This whitepaper was authored by Dirk Vermeiren, Co-founder and CTO at VaultSpeed,and co-authored by Michael Olschimke, CEO at Scalefree International,and Jonas De Keuster, VP Product Marketing at VaultSpeed.
Integrating different data source views into one comprehensive perspective
Automating common understanding


Welcome to the real world
In corporate operations, a company’s understanding of its business processes, products, and target audience often clashes with the varied terminologies used across different business lines. These differences in language—combined with the natural evolution of business processes over time—create significant challenges.
This lack of alignment can hinder data integration, delay decision-making, and ultimately lead to missed business opportunities.
A common misconception continues to persist: that a single entity owns both operational and analytical data models, and that these models remain fixed and unchanged.
To illustrate the real-world implications, imagine working for a vehicle dealership in a simplified, unchanging environment. You are solely responsible for developing all operational and analytical data systems. You’ve built two source systems—one for Customer Relationship Management (CRM) and another for Enterprise Resource Planning (ERP). Both systems include data related to the company’s product offerings.
Now, you are asked to create an integrated solution to analyze the vehicle portfolio, including both bikes and cars. In this idealized world, where business definitions never shift, the product entity would be identically configured in both systems using the same unique identifier. This uniformity would allow for seamless data consolidation, making the integration process both simple and efficient.
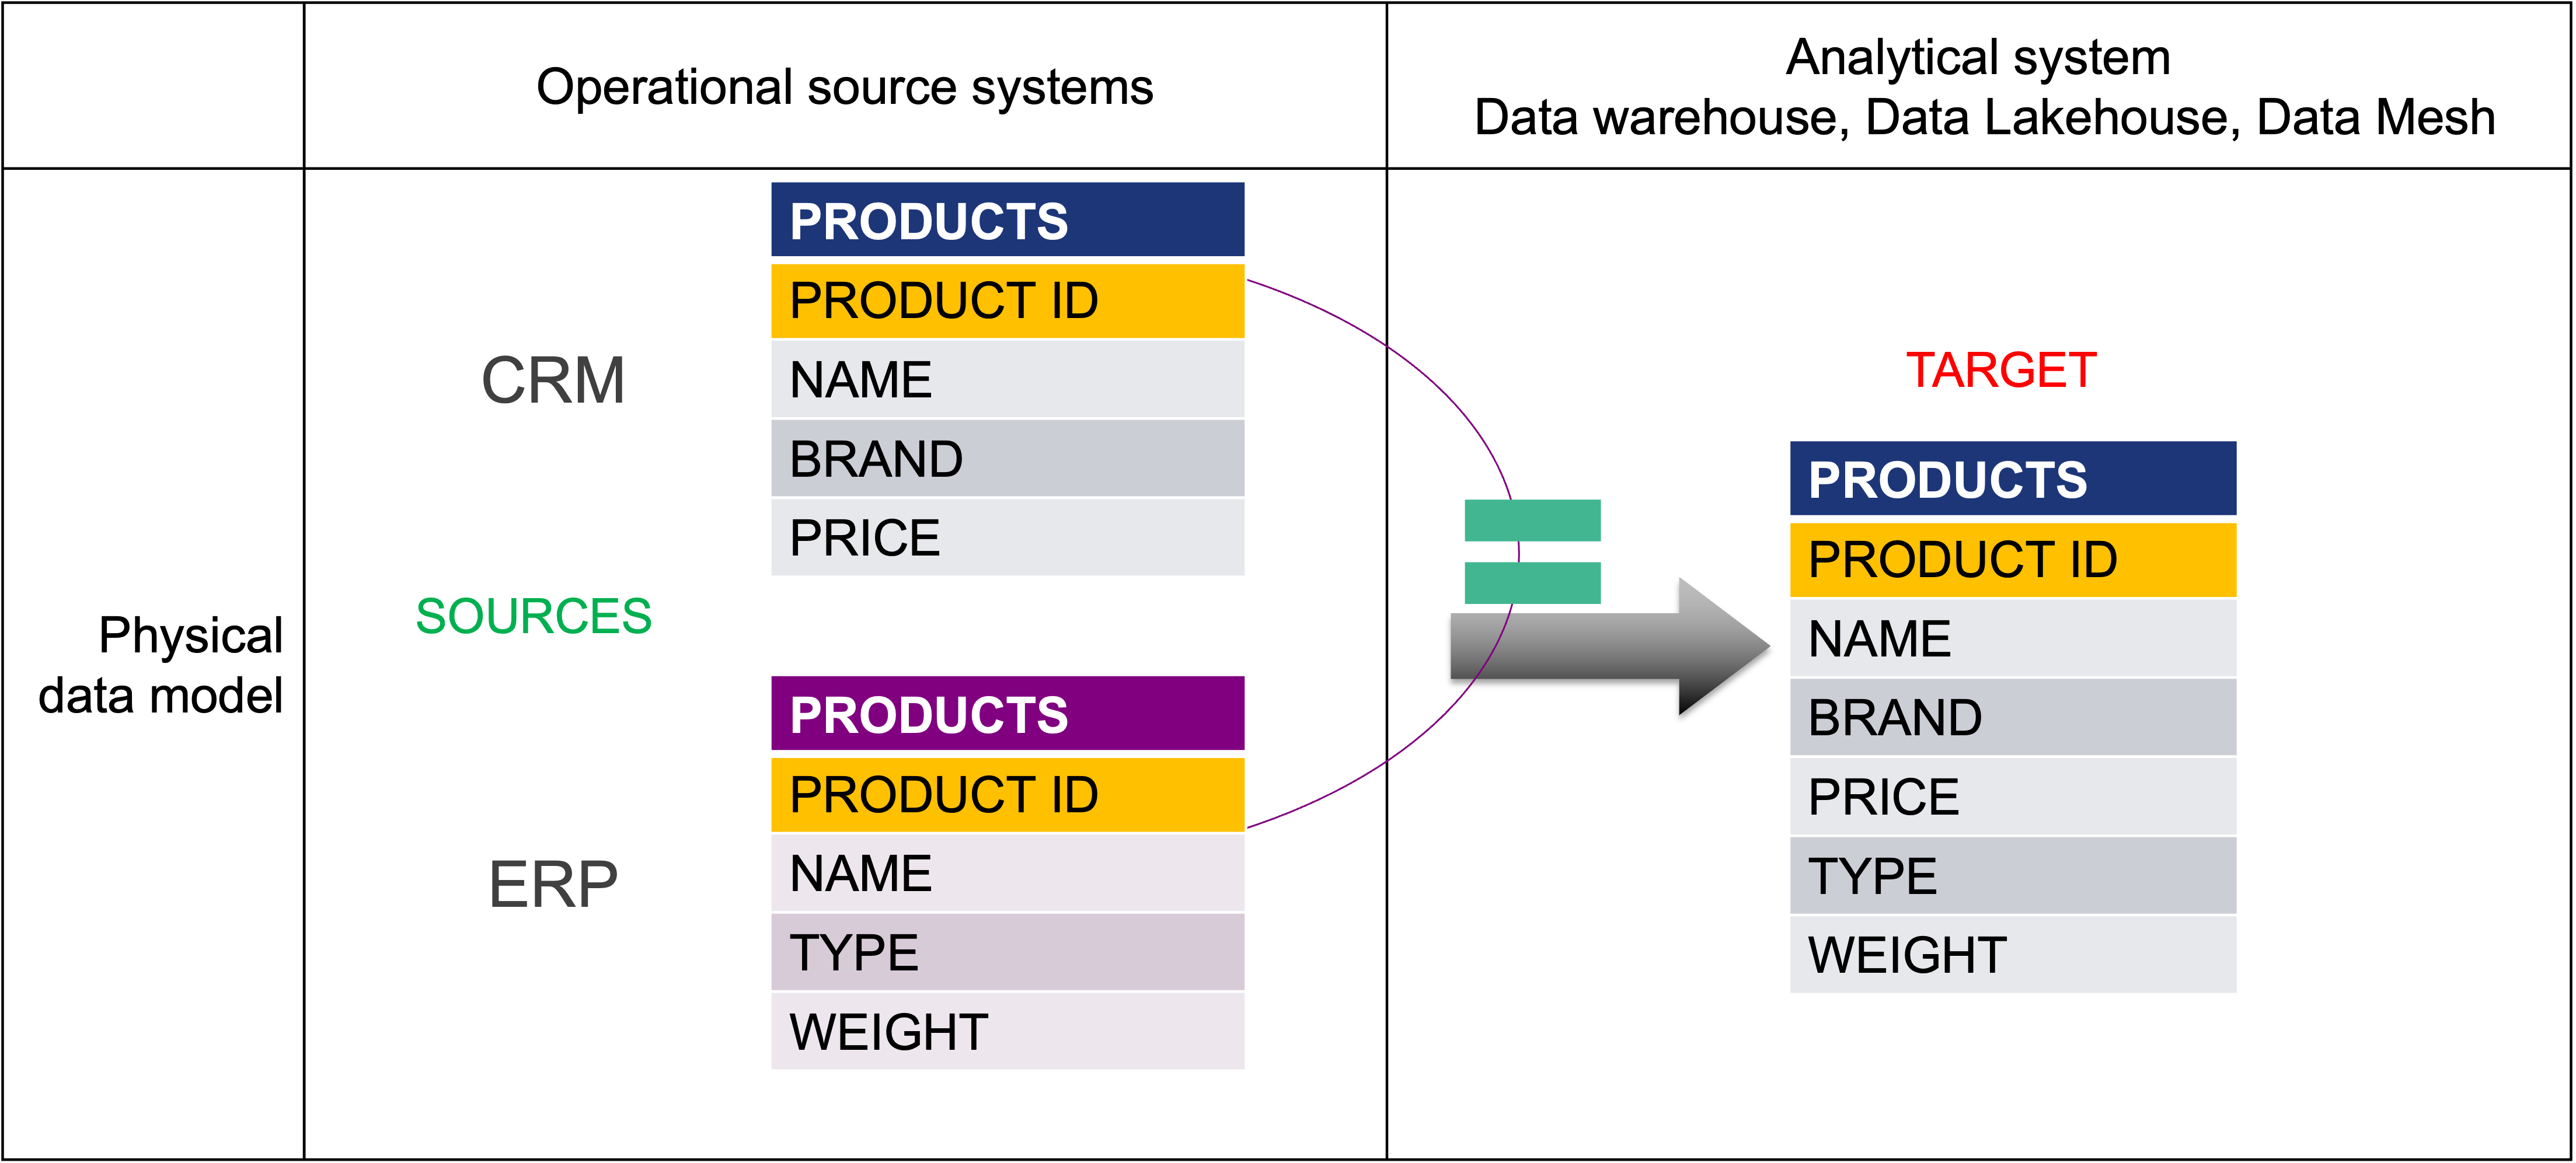
Picture 1
It’s time to acknowledge that perfect conditions don’t exist. Why? Because you're not alone in building and maintaining operational systems. These systems are often developed by different individuals or sourced from external vendors. As time passes, businesses evolve—what is valuable today may be irrelevant tomorrow. Growth brings added complexity, and frequent team turnover further complicates things by introducing shifting perspectives within the data team.
Each system inevitably develops its own interpretation of business concepts, processes, and development styles. 
As a result, integrating datasets—especially product data—has become increasingly challenging. For instance, as shown in Picture 2, the CRM system focuses on bicycles, while the ERP system categorizes products as non-motorized vehicles. These differences lead to varying levels of detail and inconsistent use of business keys, making integration anything but straightforward.
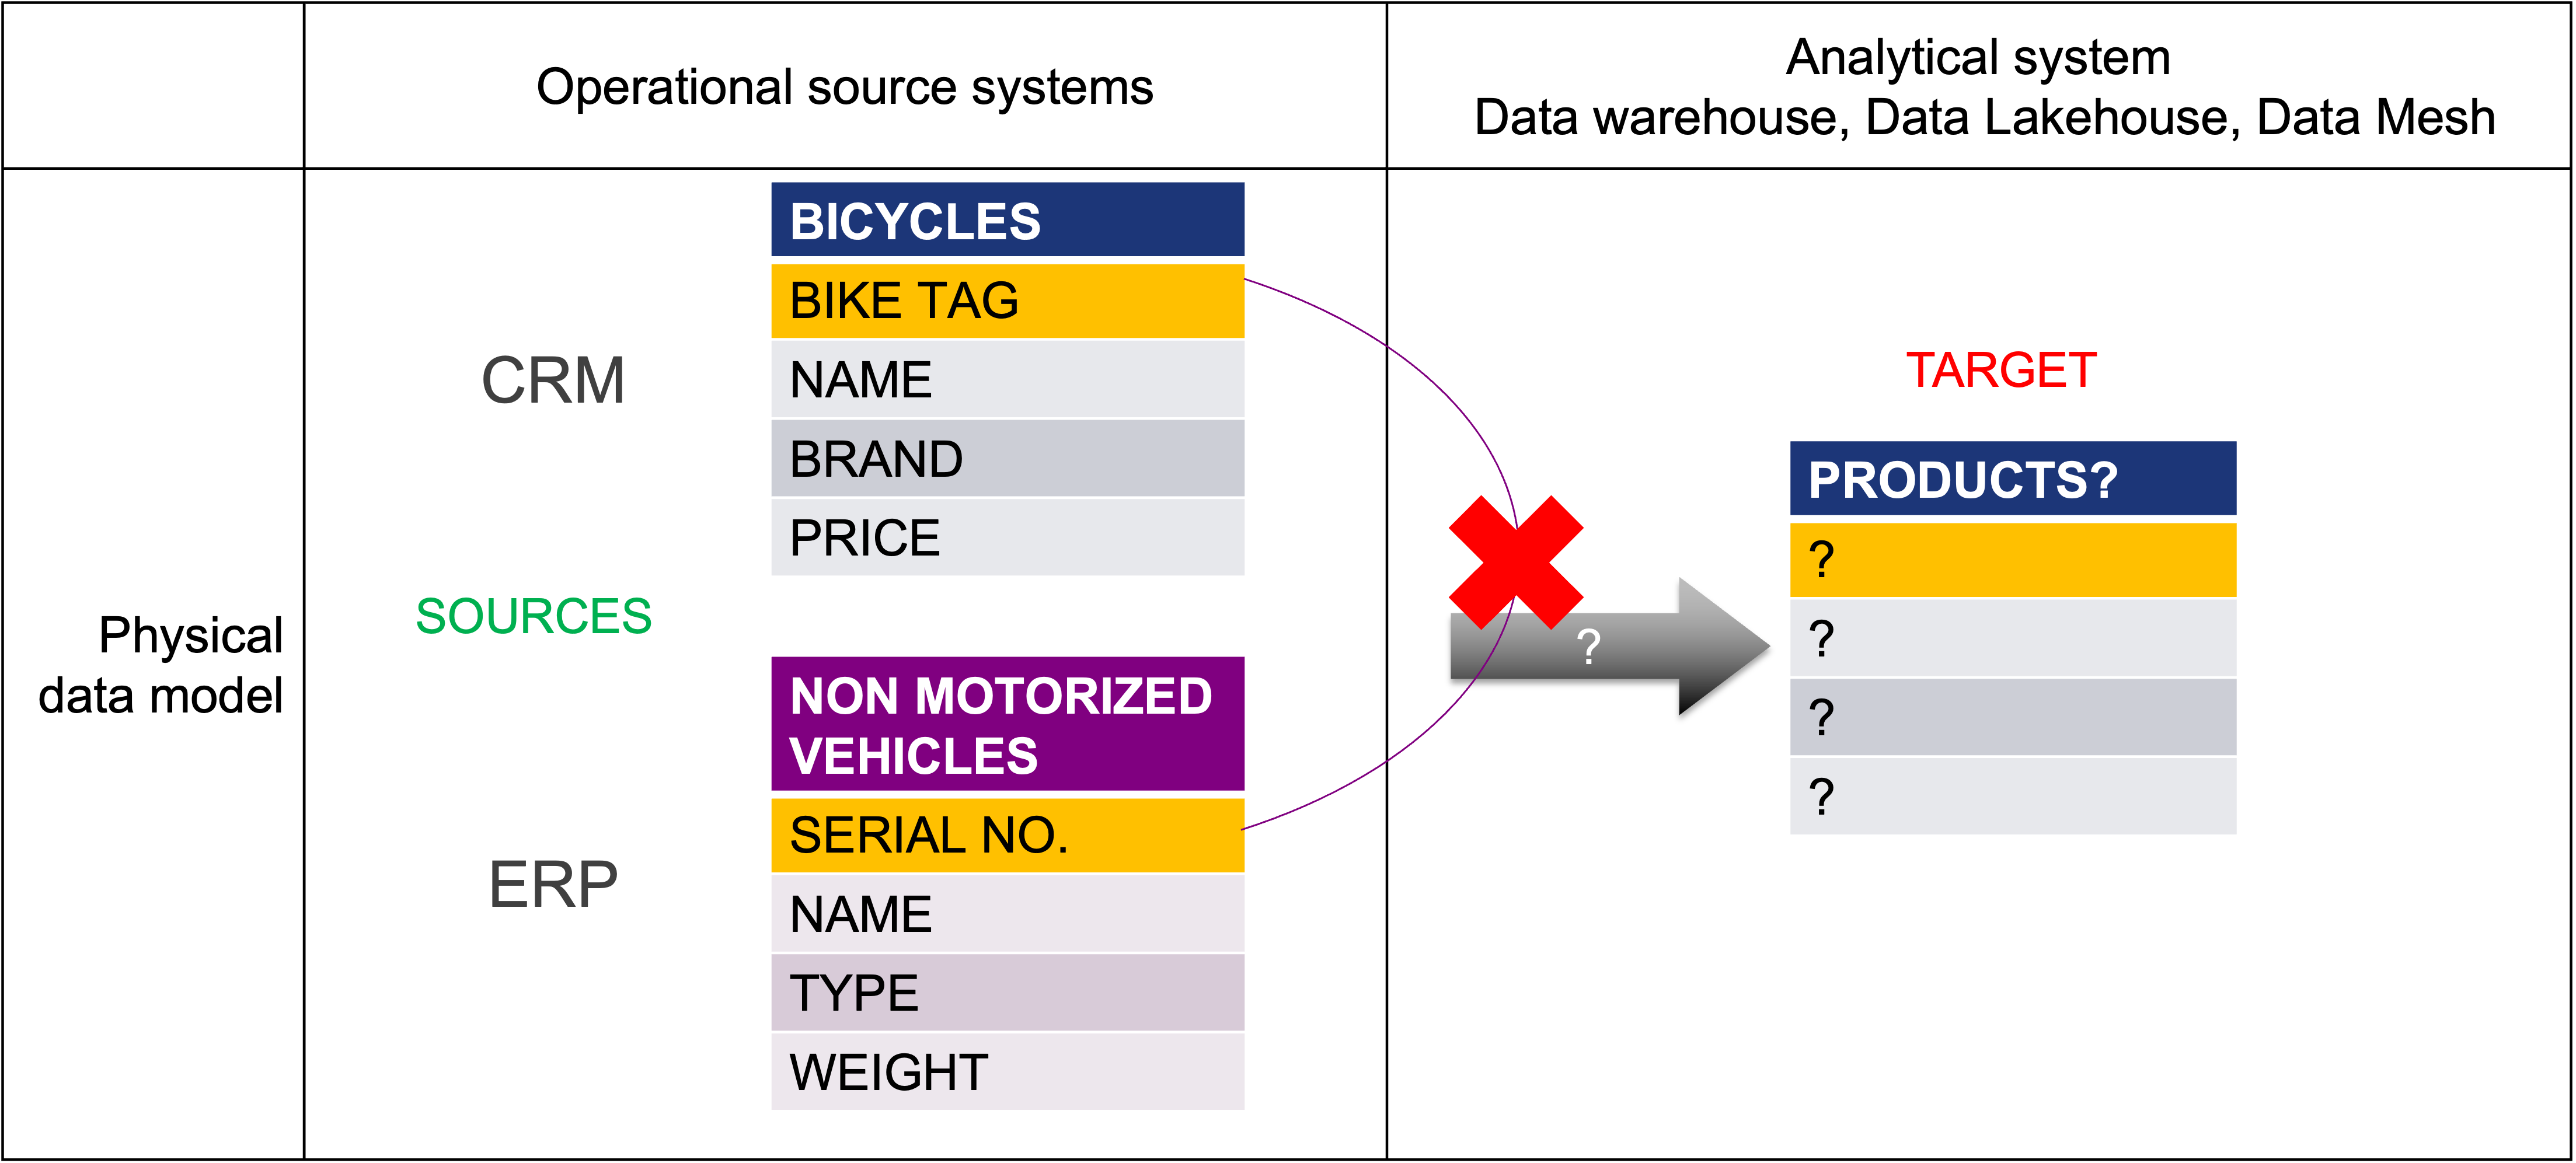
Picture 2
Coping with data complexity
Industry data models are not silver bullets
In an effort to standardize analytics, vendors once promoted pre-defined industry data models as comprehensive solutions for organizing, storing, and processing data across specific verticals—all the way down to the physical model level. The promise was appealing: a ready-made framework to accelerate integration and reduce complexity.
In practice, however, this one-size-fits-all approach quickly showed its limits. Source systems rarely aligned with the imposed structures, and many organizations operated in ways that deviated—if only slightly—from the model. These mismatches led to increased integration complexity and substantial transformation overhead.
Rather than simplifying data integration, industry models often made it more difficult. What was intended as a shortcut became an extra layer of work. The silver bullet never hit its mark.
Addressing data complexity through proper data modeling
To address the complexity of data integration, data modelers use a layered approach that includes conceptual, logical, and physical data models. In the vehicle dealership example, the focus was primarily on integration at the physical level. But in real-world scenarios, effective data modeling should begin at the conceptual level.
Conceptual data model
The conceptual model—often called the business model—offers a perspective that is easy for business stakeholders to understand. Its primary purpose is to define key entities, such as objects, concepts, or events, and map the relationships between them. Operating at the highest level of abstraction, the conceptual model avoids technical details. Instead, it focuses on aligning data design with overarching business concepts and requirements, without addressing how or where the data is stored or accessed.
Logical data model
The logical data model transitions from business context to structure, focusing on defining data elements in a technology-agnostic way. It specifies entities, attributes, relationships, and constraints, often visualized using tools like entity-relationship diagrams (ERDs). This model offers a clear, detailed view of how data elements relate to one another and establishes the rules that govern those relationships.
Physical data model
When designing a database, decisions about data storage, structure, and access become critical. This is where the physical data model plays its role. It addresses practical considerations like indexing, data types, and storage mechanisms to ensure optimal performance and efficiency. All these decisions must also comply with the limitations and features of the selected Database Management System (DBMS).
Together, the three levels of data modeling—conceptual, logical, and physical—help organizations manage the complexity of diverse datasets from an ever-expanding range of sources, each with its own taxonomy. Ideally, both operational and analytical systems are designed from a shared conceptual model. This ensures that while the logical and physical models may differ in granularity and use different business keys, they remain aligned to a common blueprint.
This alignment is essential when translating the physical data models of source systems into the physical model of the target analytical platform.
The diagram below illustrates the recommended approach for building data models in a data warehouse, data lakehouse, or data mesh architecture. It highlights two key inputs: the physical source model and the conceptual business model. The objective is to construct a well-aligned physical target model that supports accurate and efficient analytics
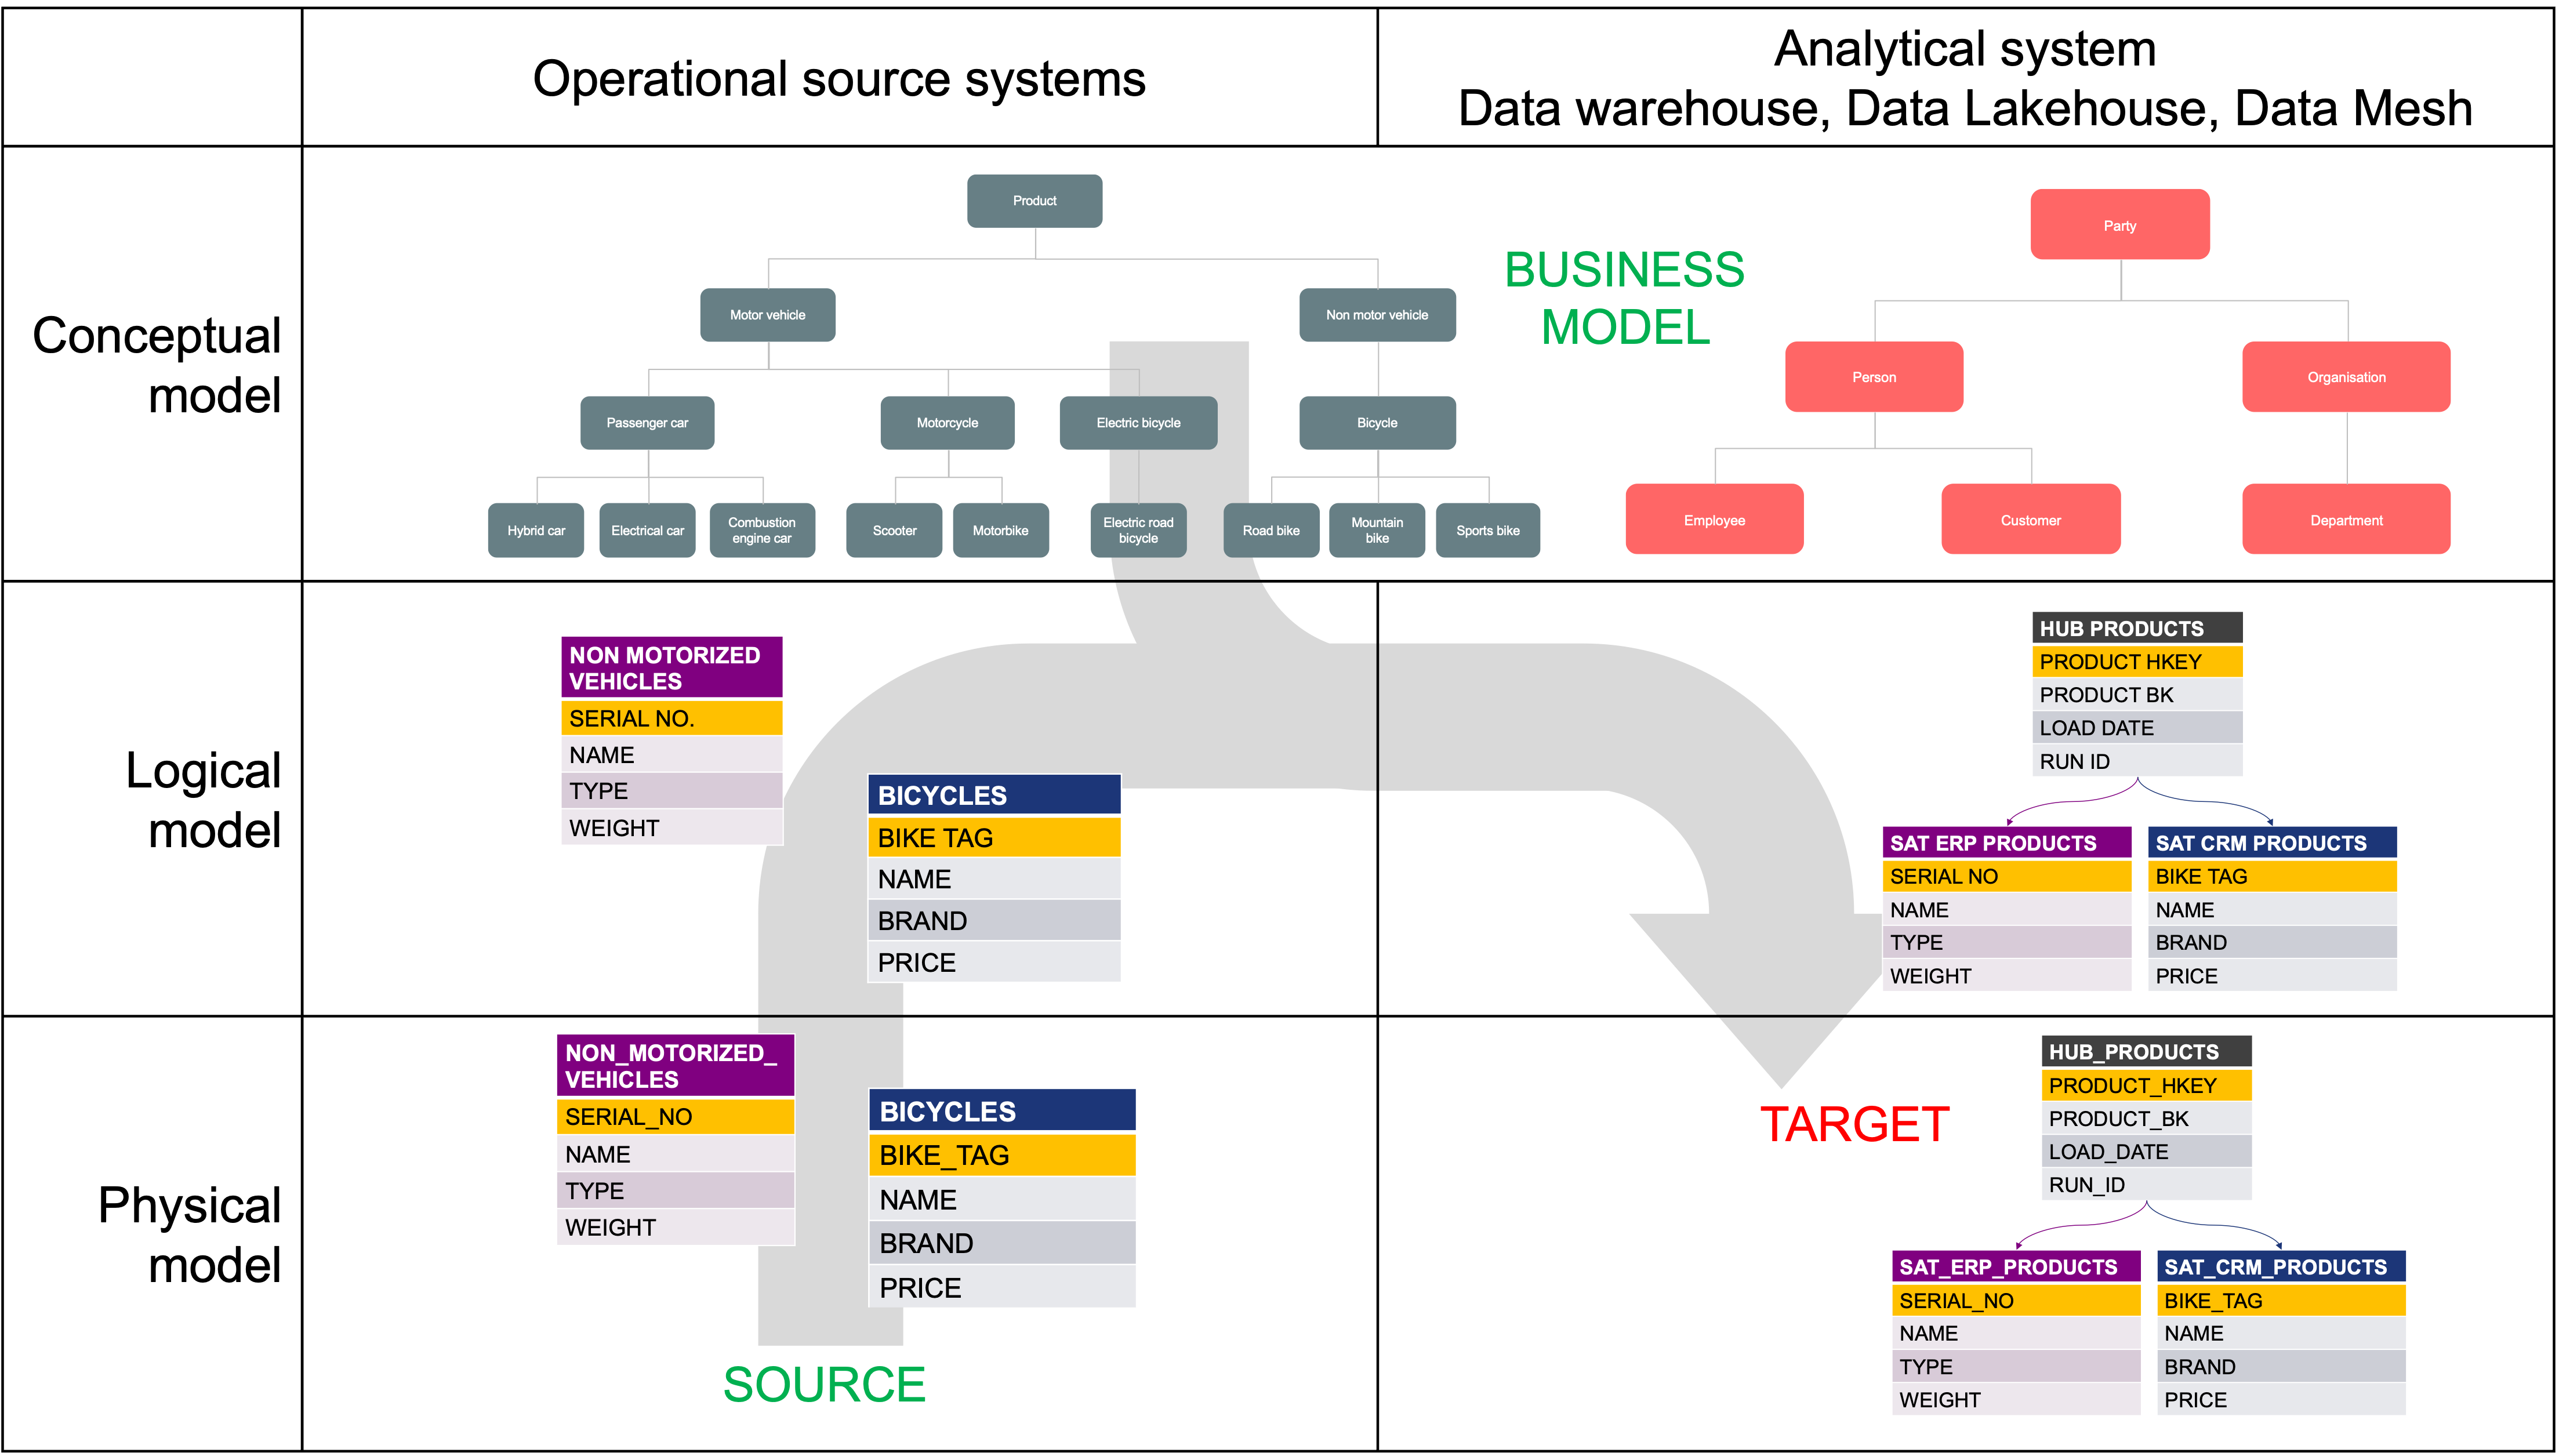
Picture 3
Another vital ingredient to deal with complexity and change is to automate the creation of data models and data runtime. This can significantly reduce the time it takes to accommodate new data requirements and mitigate the effects of change on the delivery of reliable, high-quality data. To achieve this automation, a clear definition of the relationship between physical source and target models is essential. We will delve into the topic of automation further ahead.
In conclusion, to create a data analysis system, such as a data warehouse, or data lakehouse, it is crucial to adhere to certain guidelines:
- Establish a clear and consistent conceptual data model that is easily understood by business stakeholders.
- Avoid creating or utilizing industry-specific data models at the physical level, as this may lead to issues when integrating different data sets.
- Avoid simply replicating the operational data models of your data sources, as this can lead to integration challenges.
- Embrace data automation whenever possible.
Balancing these seemingly contradictory constraints may appear challenging, but with the assistance of VaultSpeed, it becomes achievable. The VaultSpeed automation solution can translate any source data model into a comprehensive and integrated target data model, ensuring that your data analysis is accurate and efficient.
Tools to model common understanding
Create a shared language with taxonomies
In conceptual data modeling, taxonomies help organizations make sense of their data by providing structure and clarity. A taxonomy’s main role is to identify, describe, categorize, and label objects based on shared characteristics. For example, bicycles, electric bicycles, and motorcycles all have two wheels, so they can be grouped under the category of “two-wheelers.”
A taxonomy defines a formal structure of object classes within a specific domain. By organizing knowledge in a systematic way, it becomes easier to locate, relate, and manage data across systems.
A well-formed taxonomy follows several core principles:
- It uses a hierarchical structure, assigning names to objects based on their relationships to others.
- It defines clear membership properties between objects.
- It applies classification rules that are complete, consistent, and unambiguous.
- It ensures each object fits into one—and only one—category.
- It supports inheritance, allowing objects to carry properties from parent categories while adding their own specific attributes.
Taxonomy isn’t just a theoretical concept—it plays a critical role in helping organizations understand their structure, manage data effectively, and support machine learning applications by revealing patterns in the data.
In practice, large organizations often operate with multiple overlapping taxonomies. For instance, a bicycle may be classified as a two-wheeler, a non-motorized vehicle, or a light vehicle. Each of these categorizations is valid, depending on the context. Different systems may apply classification based on factors like class, propulsion type, size, intended use, or design environment.
Determining the appropriate taxonomy for your business concepts is not a one-time task. It requires ongoing review and refinement to remain aligned with an evolving business landscape. This process should involve continuous input from those who work closest to the data—ensuring the taxonomy accurately reflects the organization’s real-world structure and operations 1.
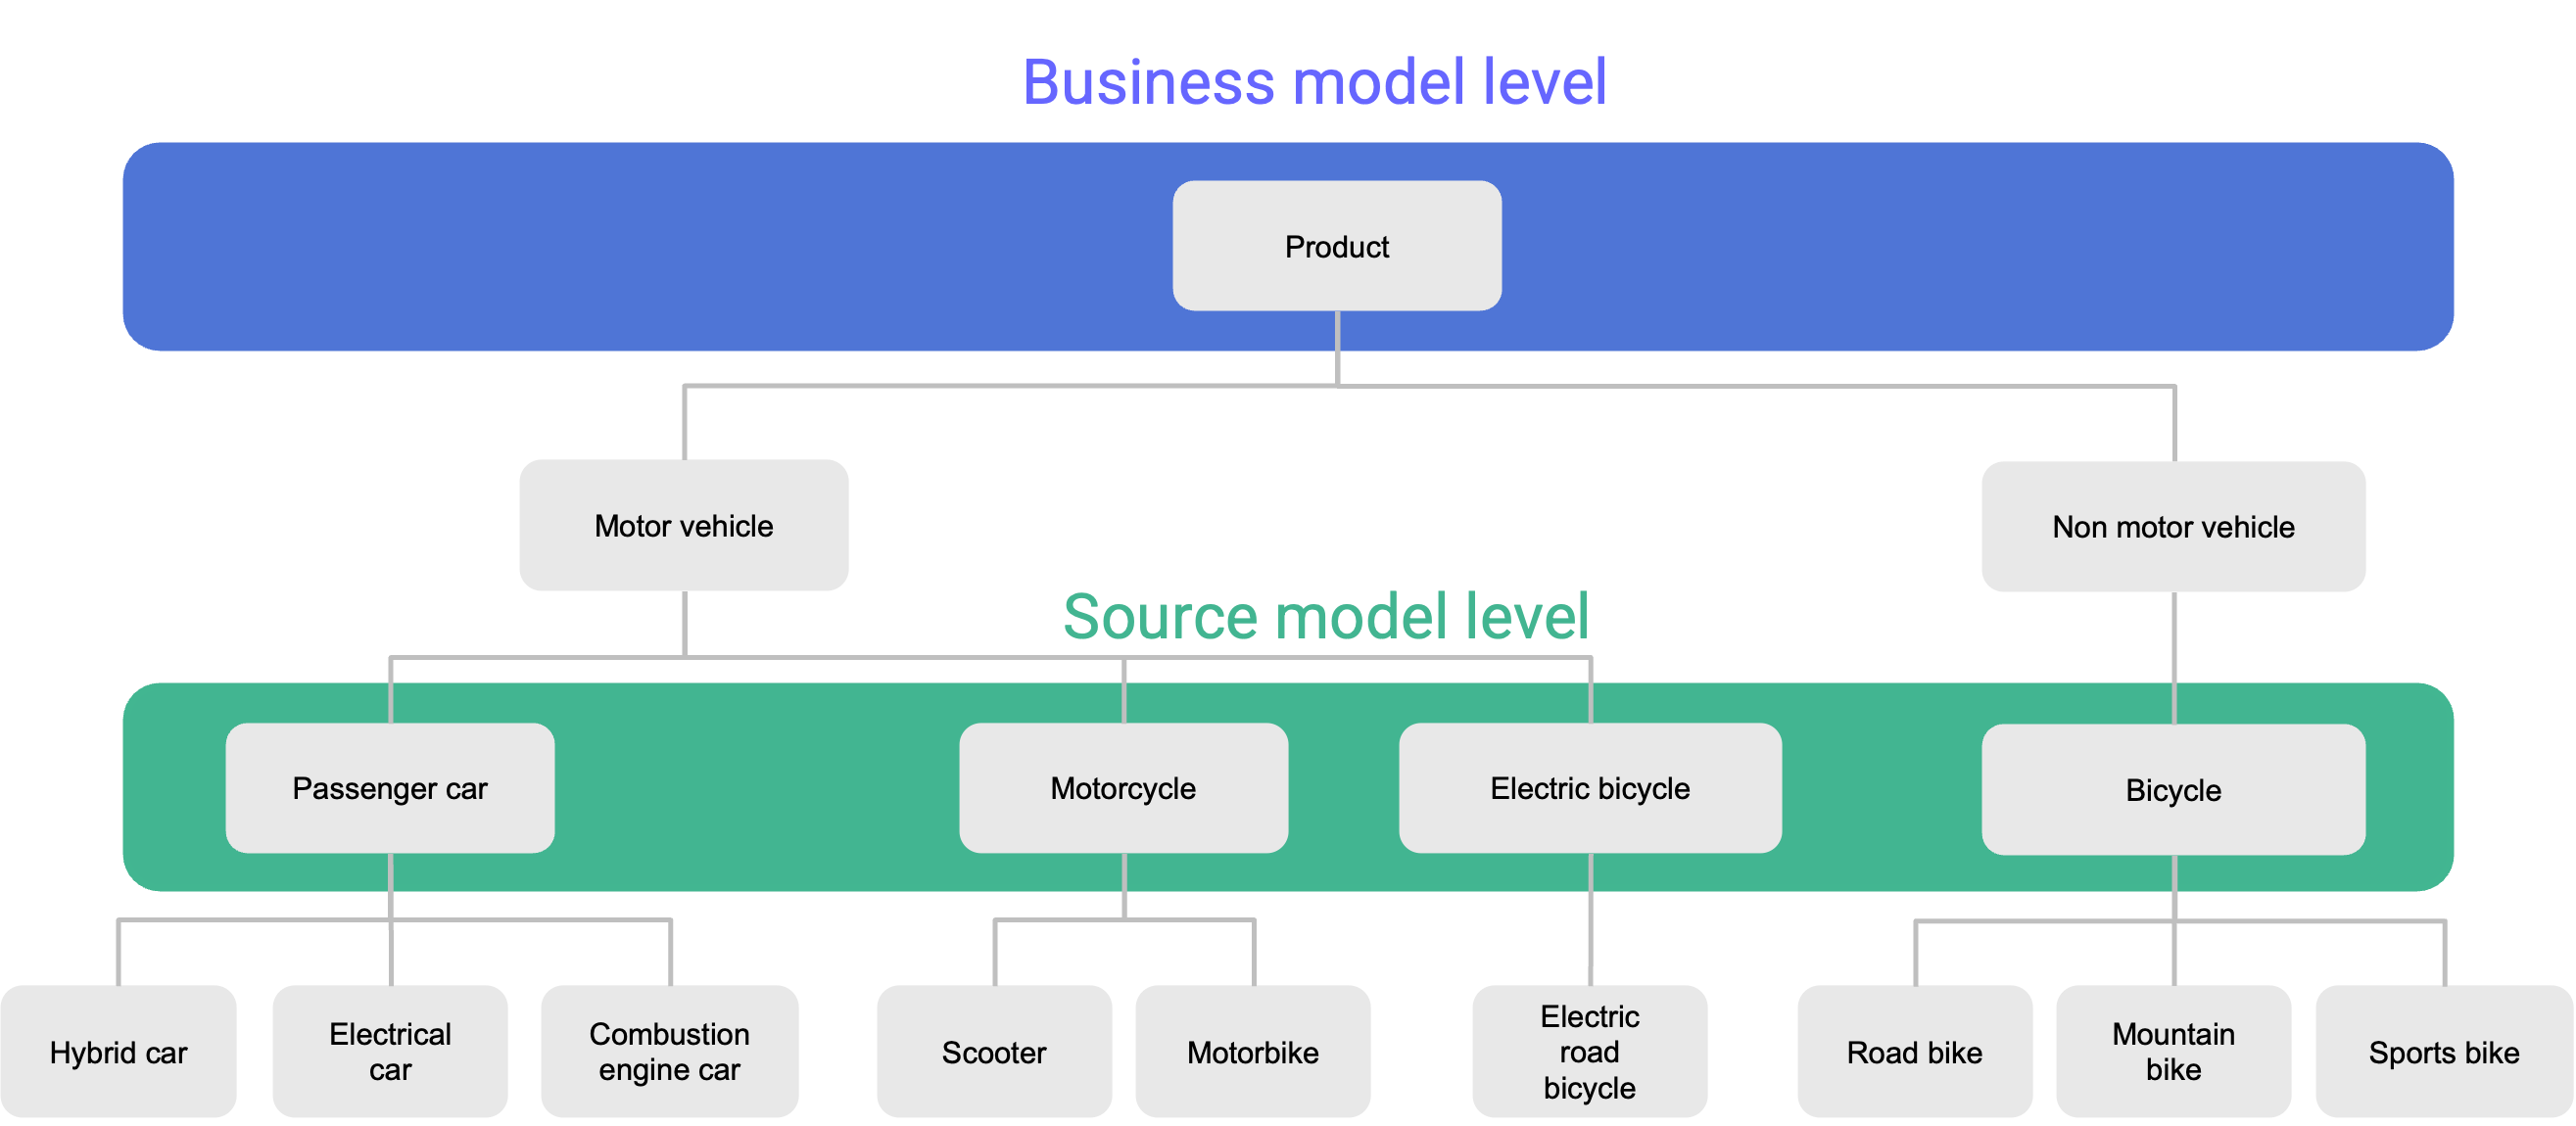
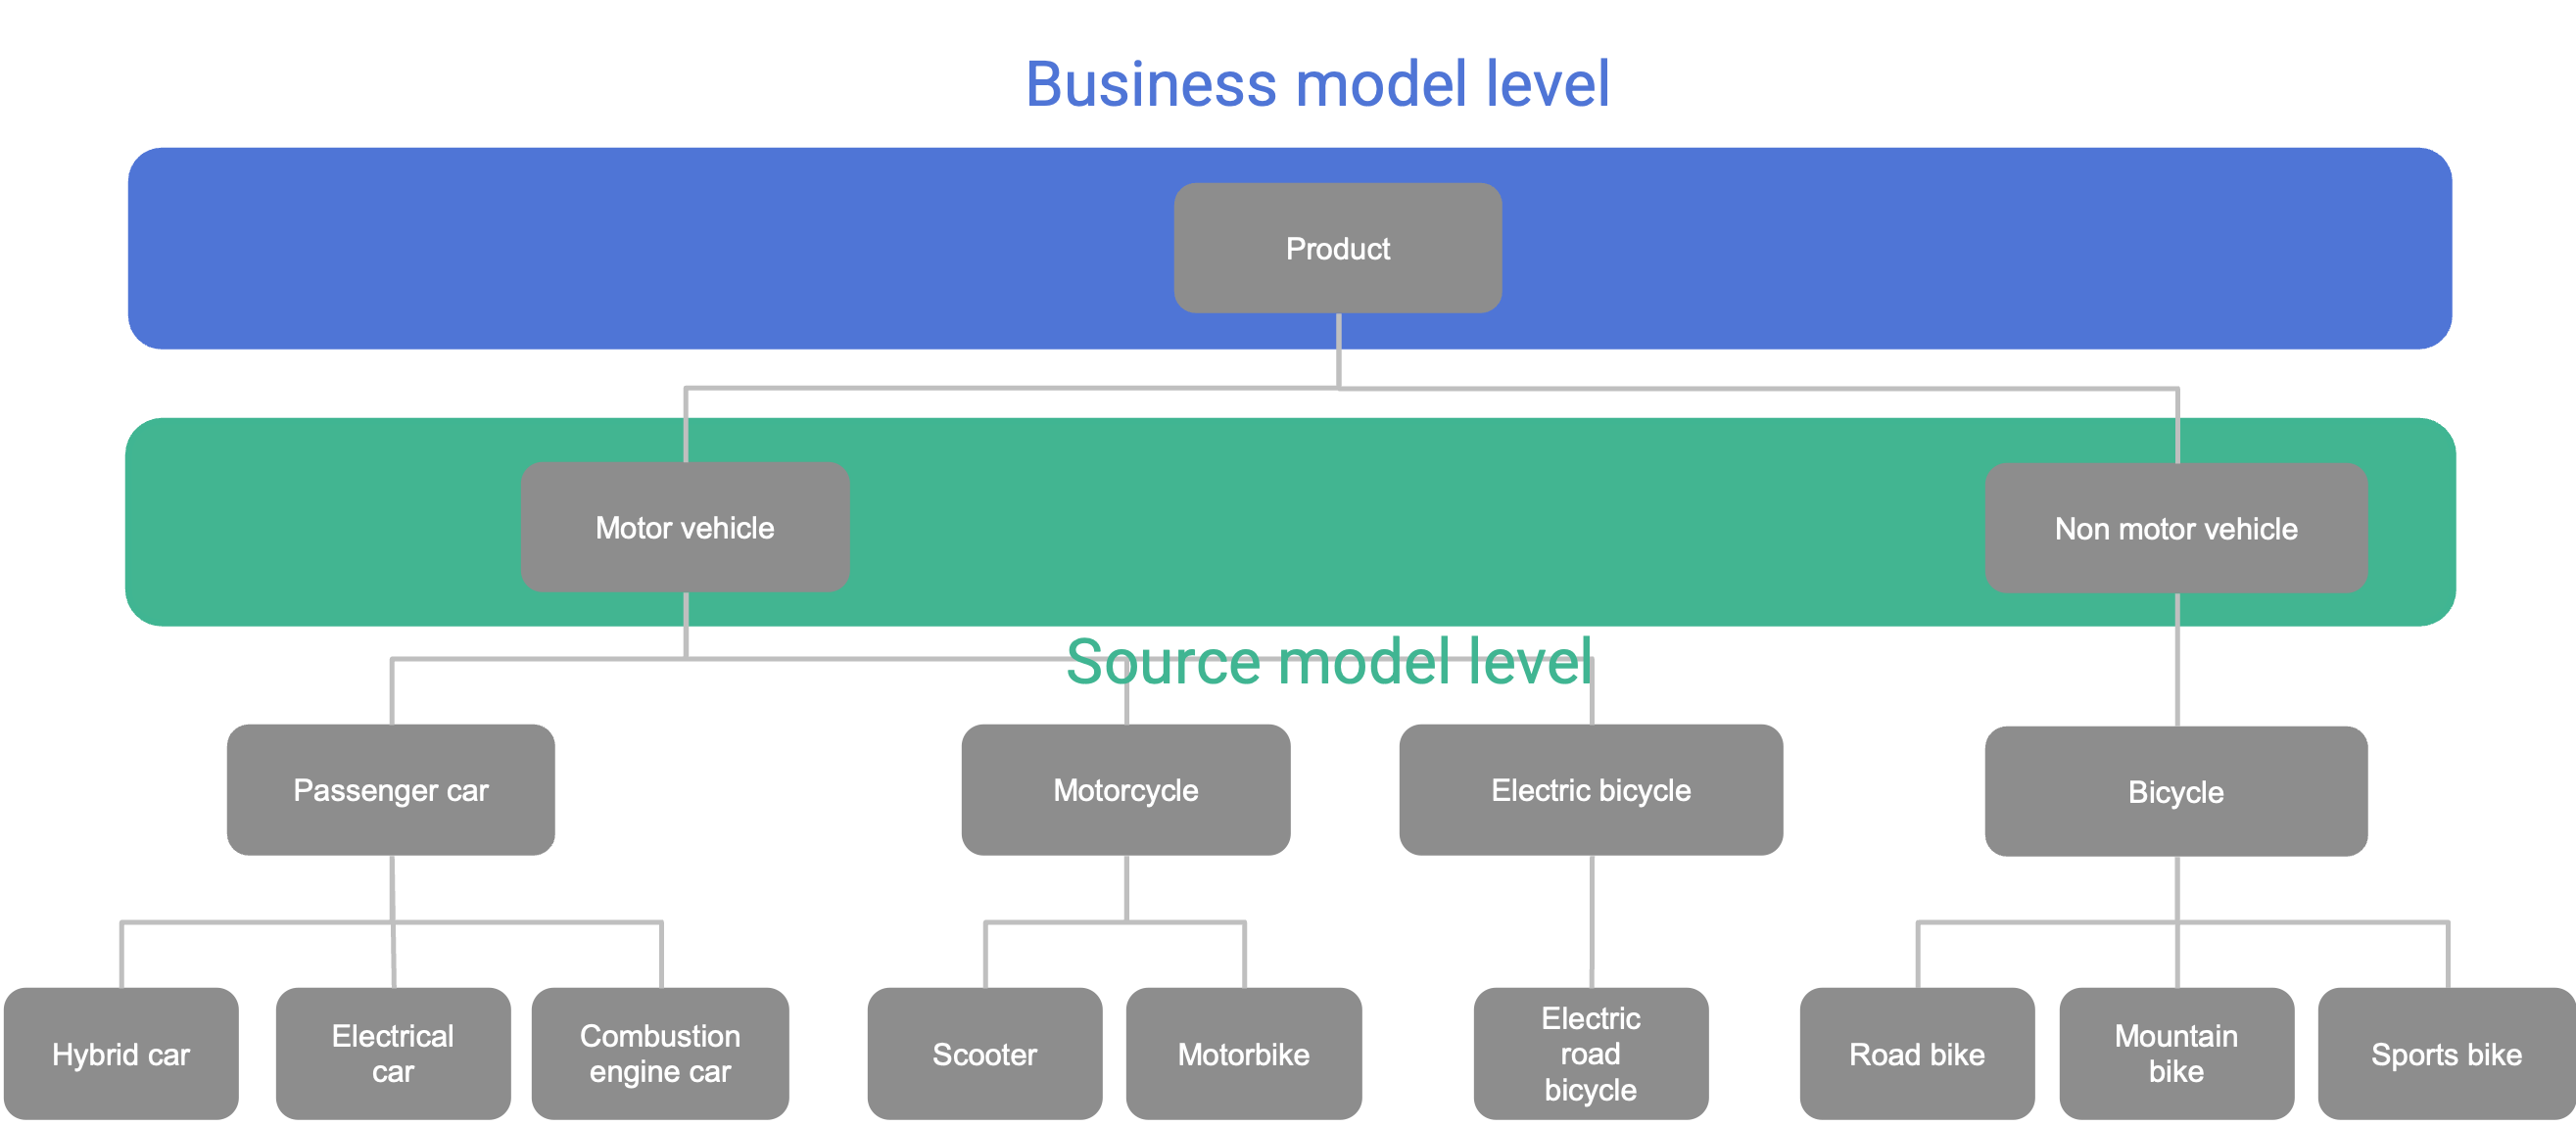
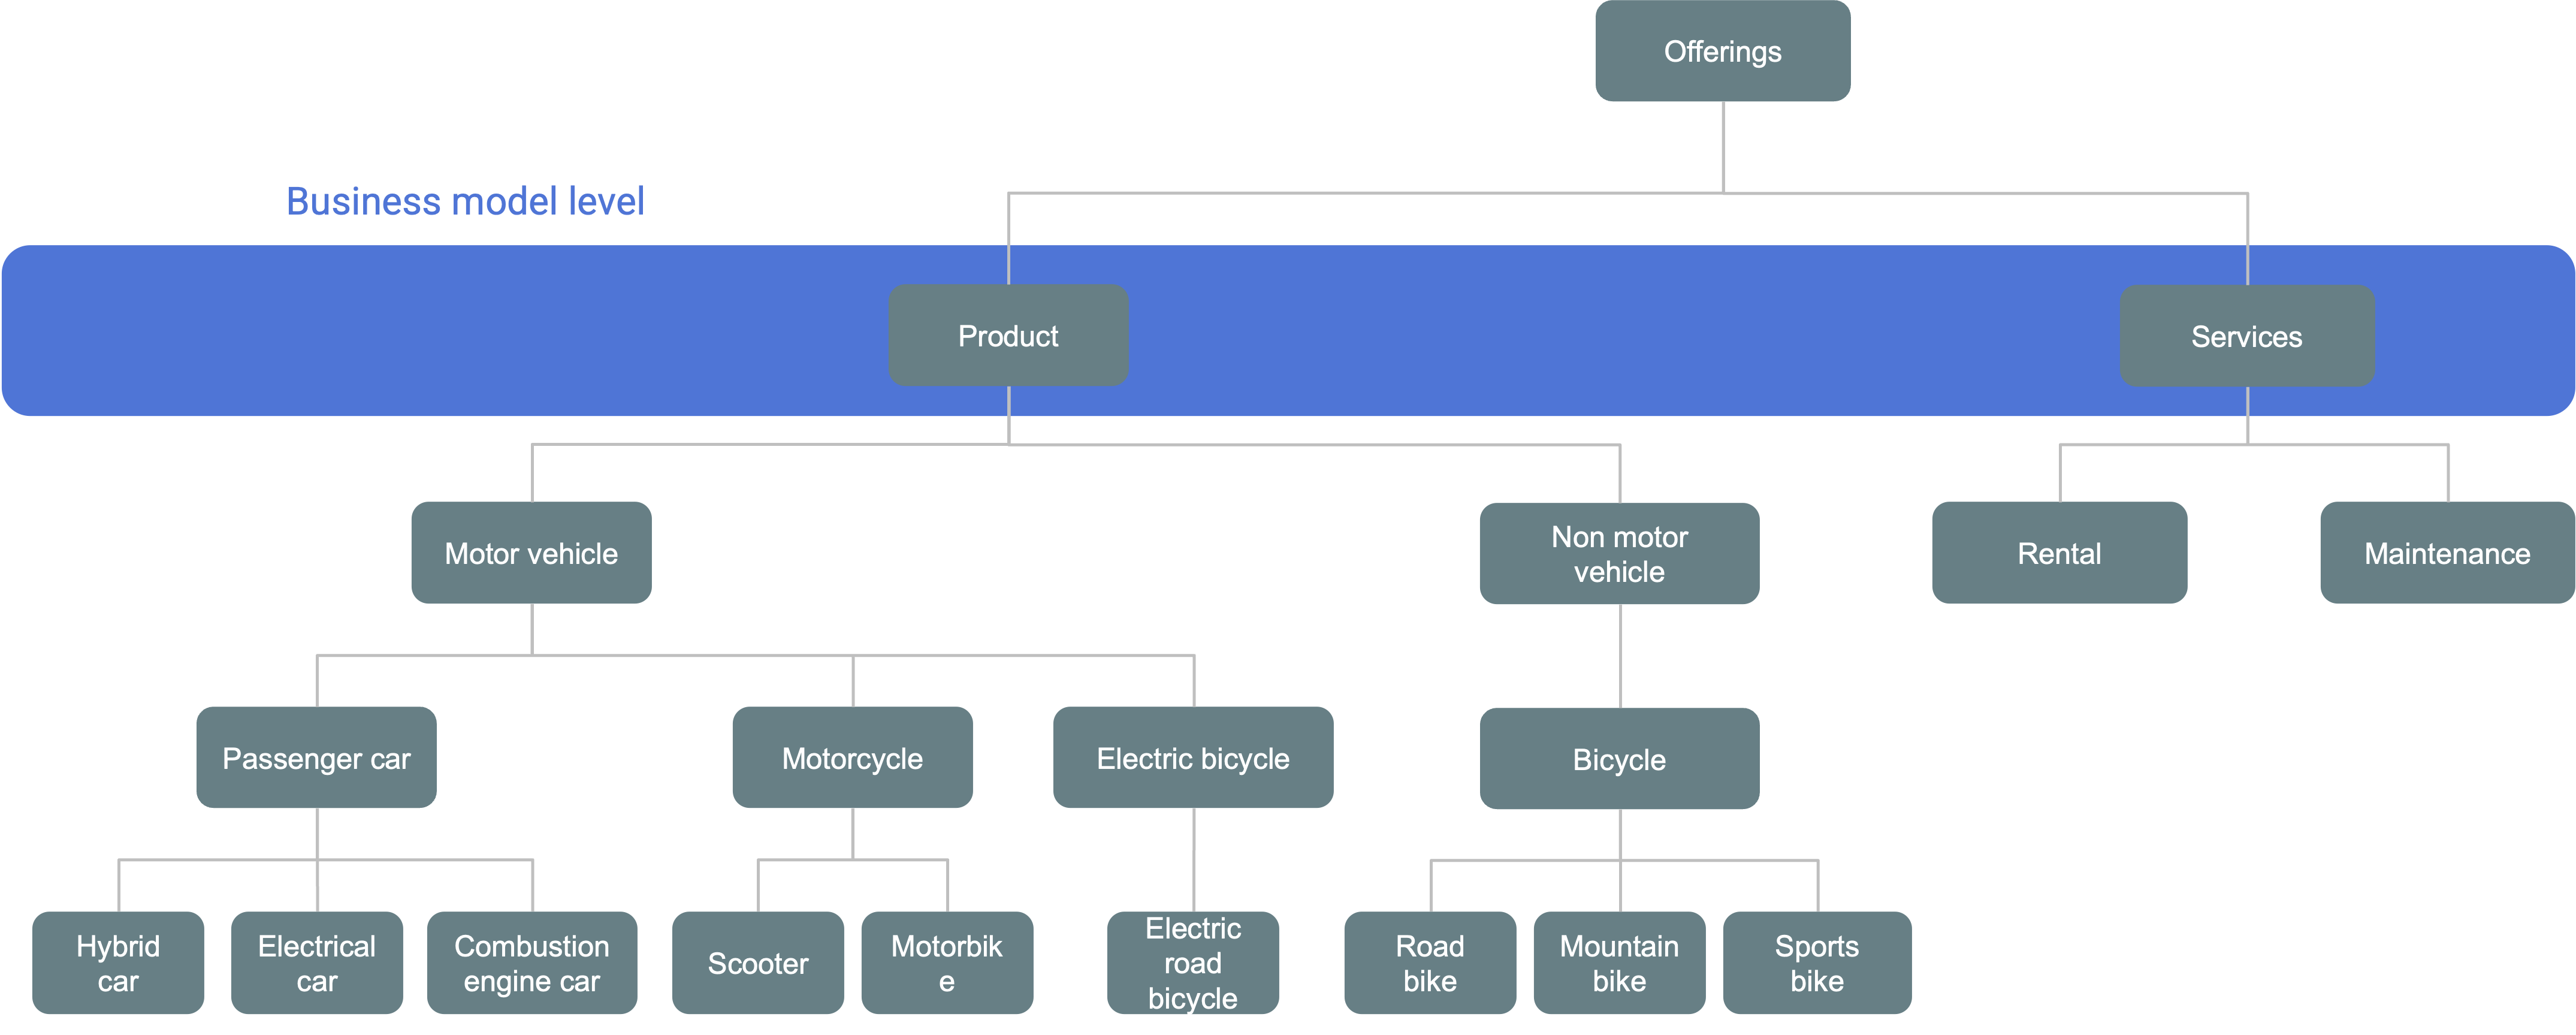
Once a shared language is established through a conceptual data model, the next step is to translate that model into a physical target model aligned with the appropriate level of the taxonomy. This physical model must accommodate different implementations across source systems, enabling integration through common business concepts defined in the taxonomy.Consider the following example: A dealership that sells bicycles and other vehicles wants to build a data warehouse to better understand the purchasing behavior of its residential customers.Here’s how the company would represent its product range:
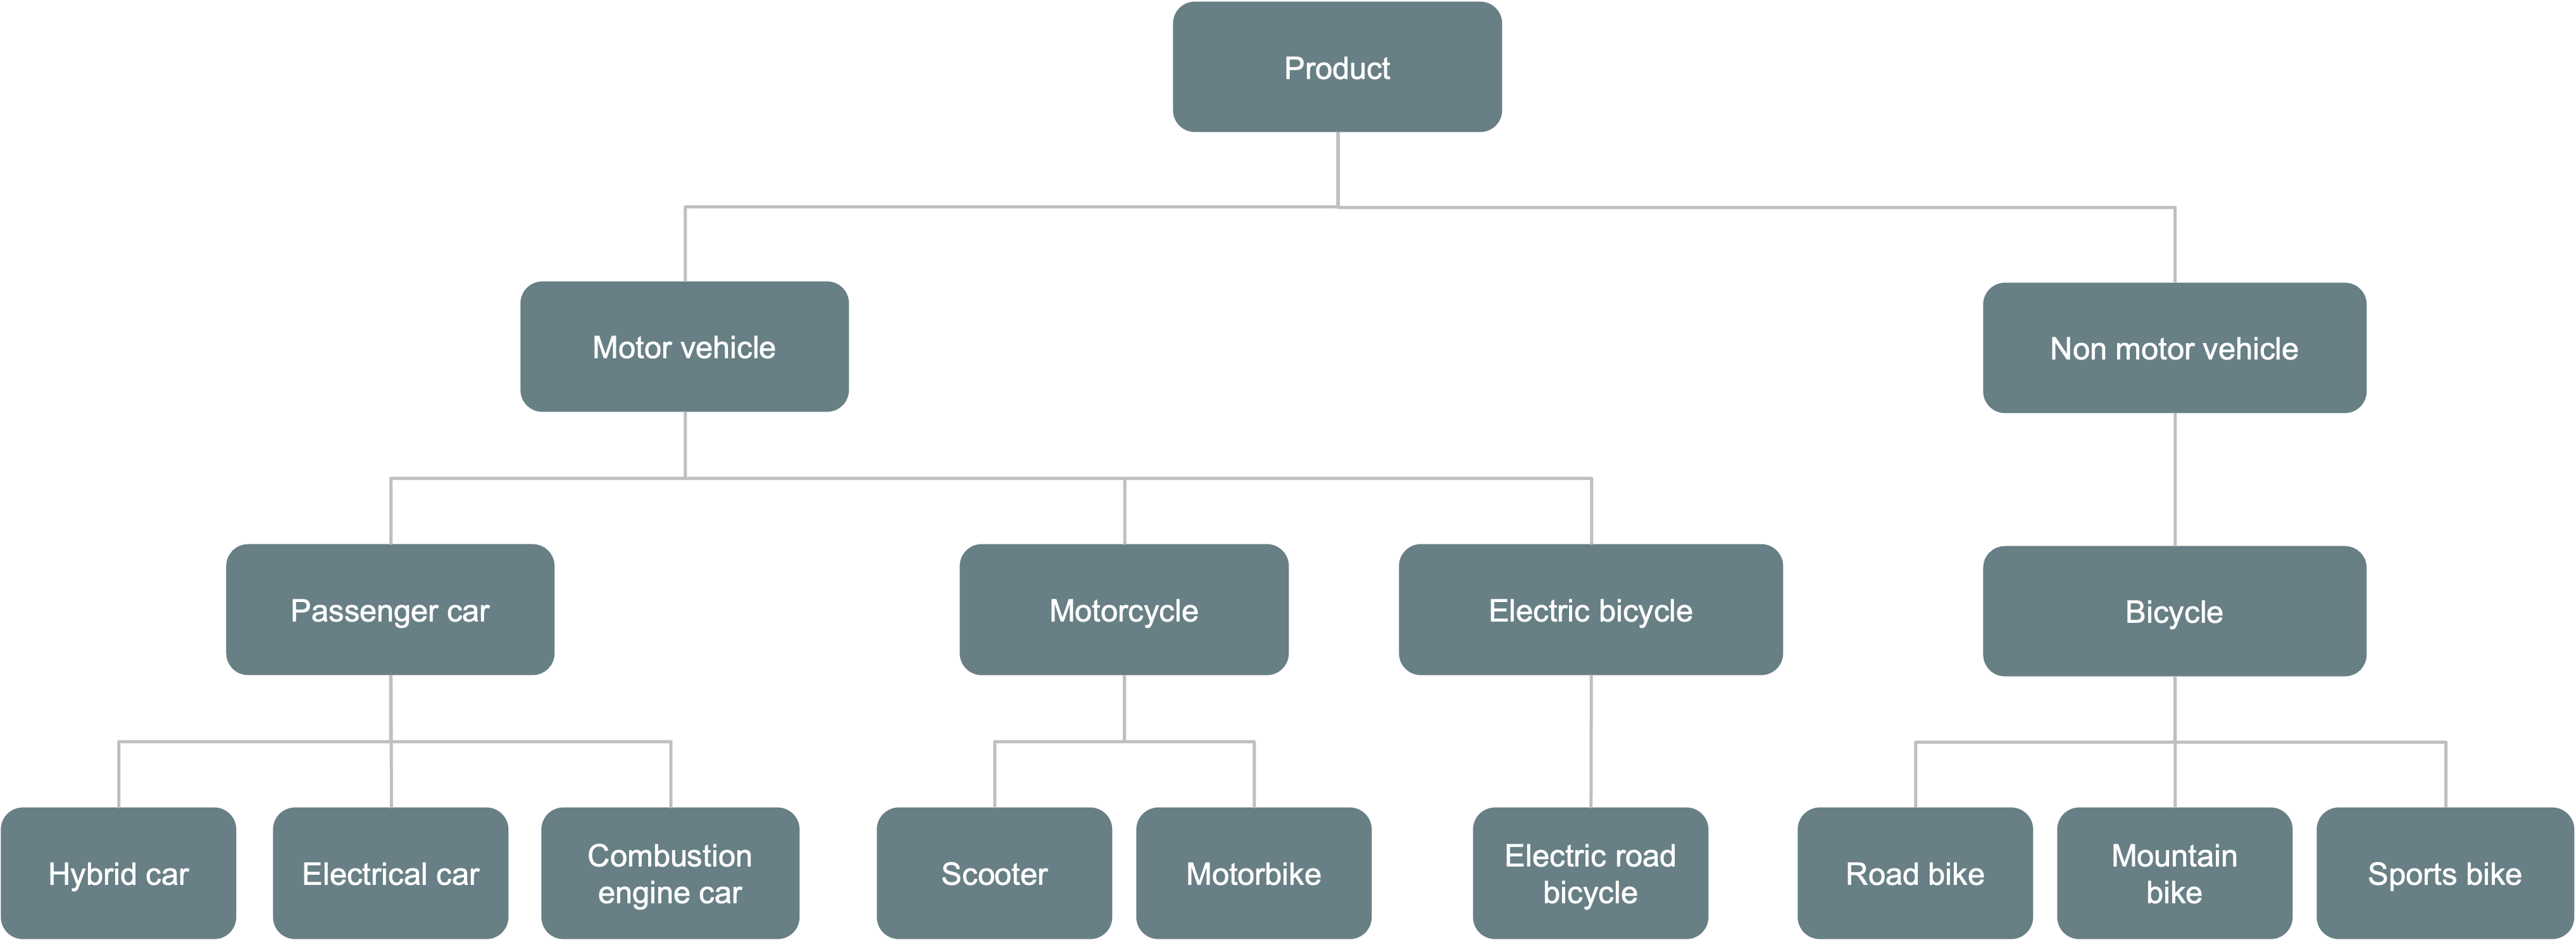
Picture 4
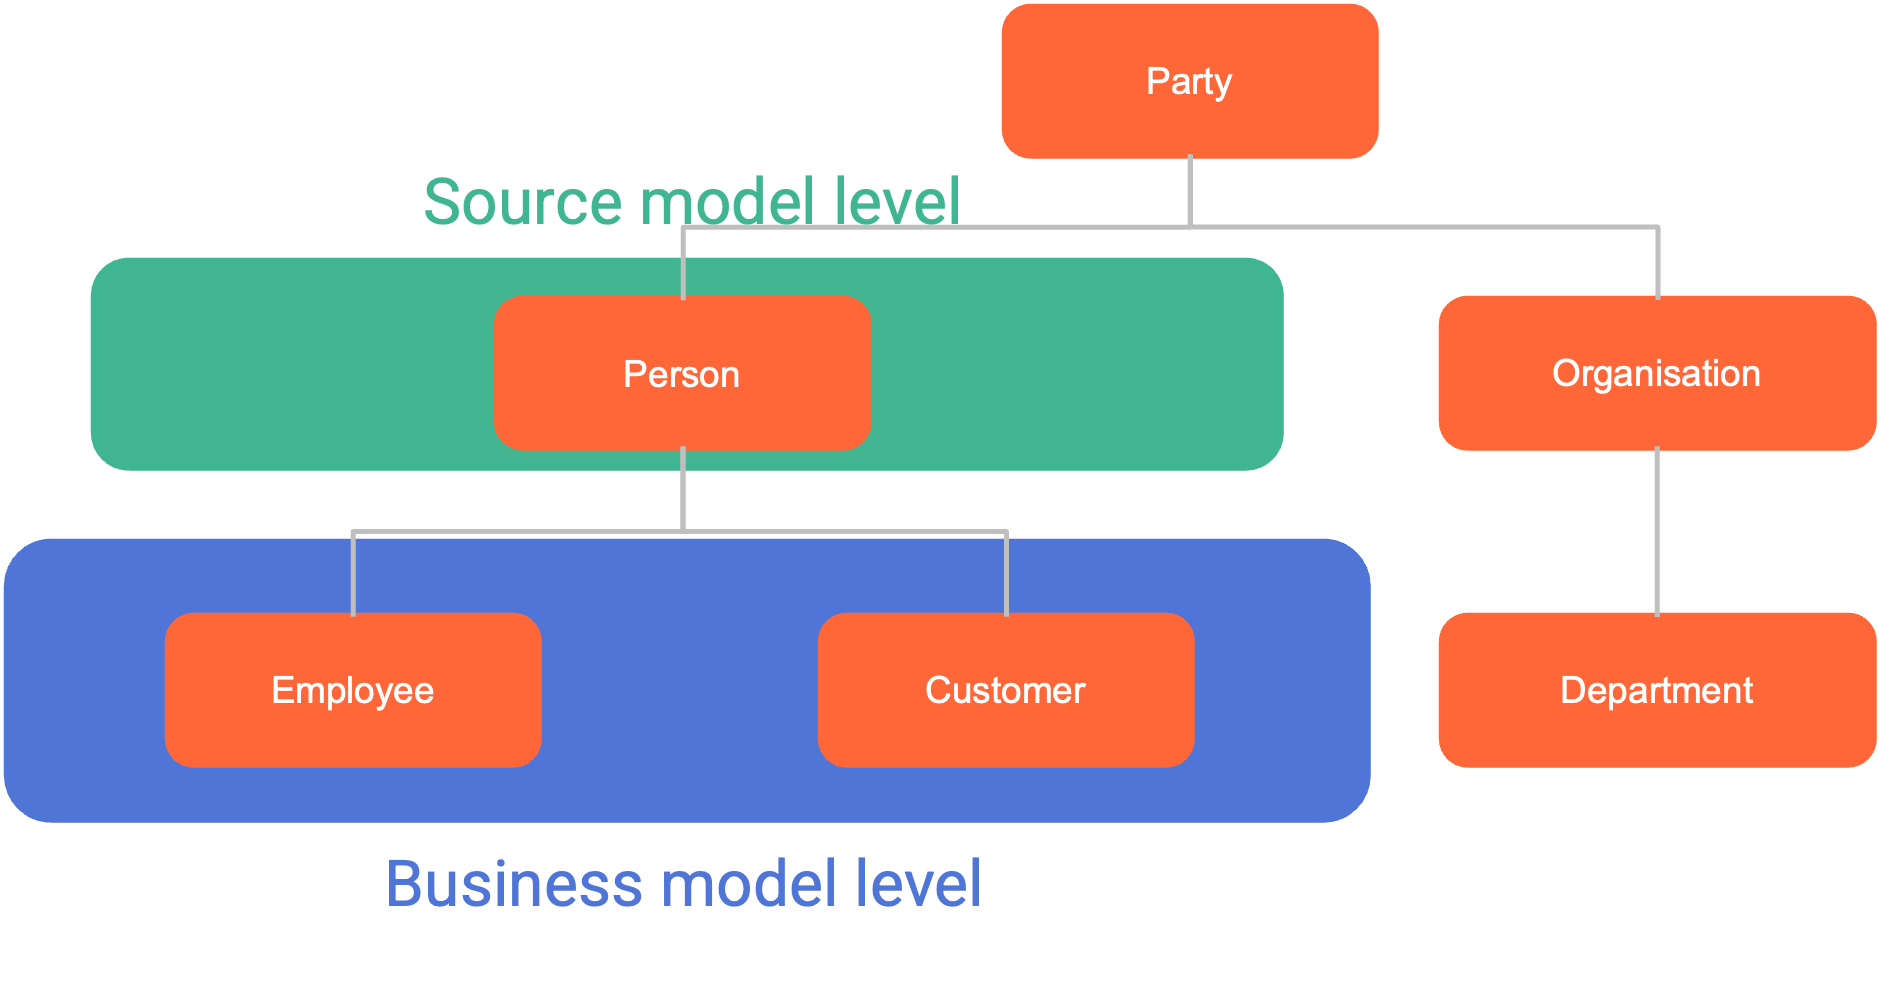
Which it sells to different parties:
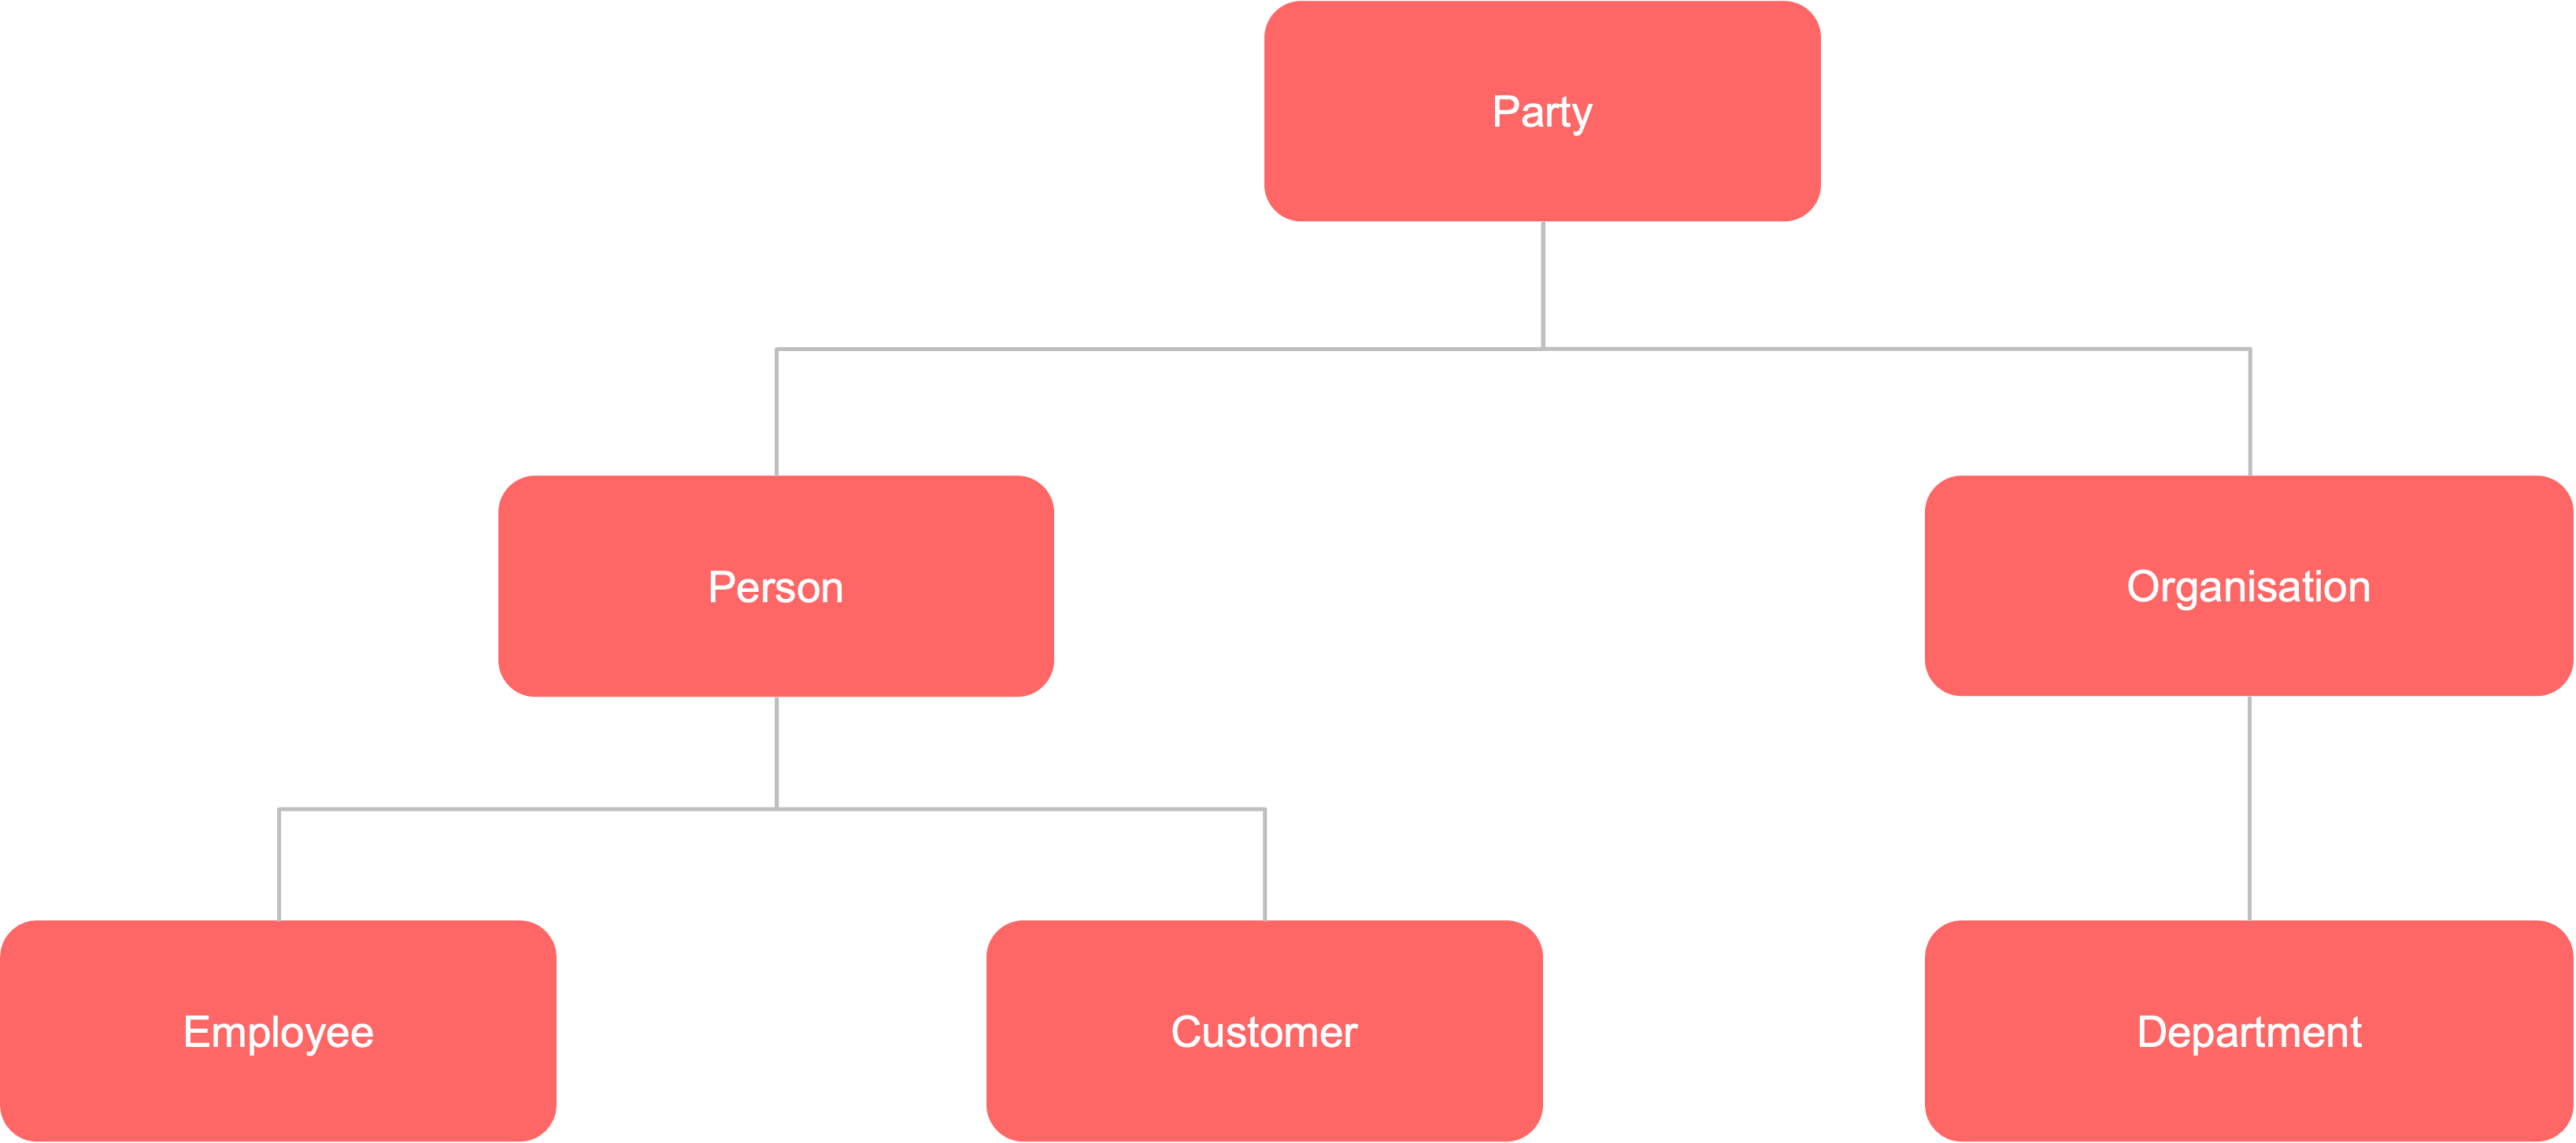
Picture 5
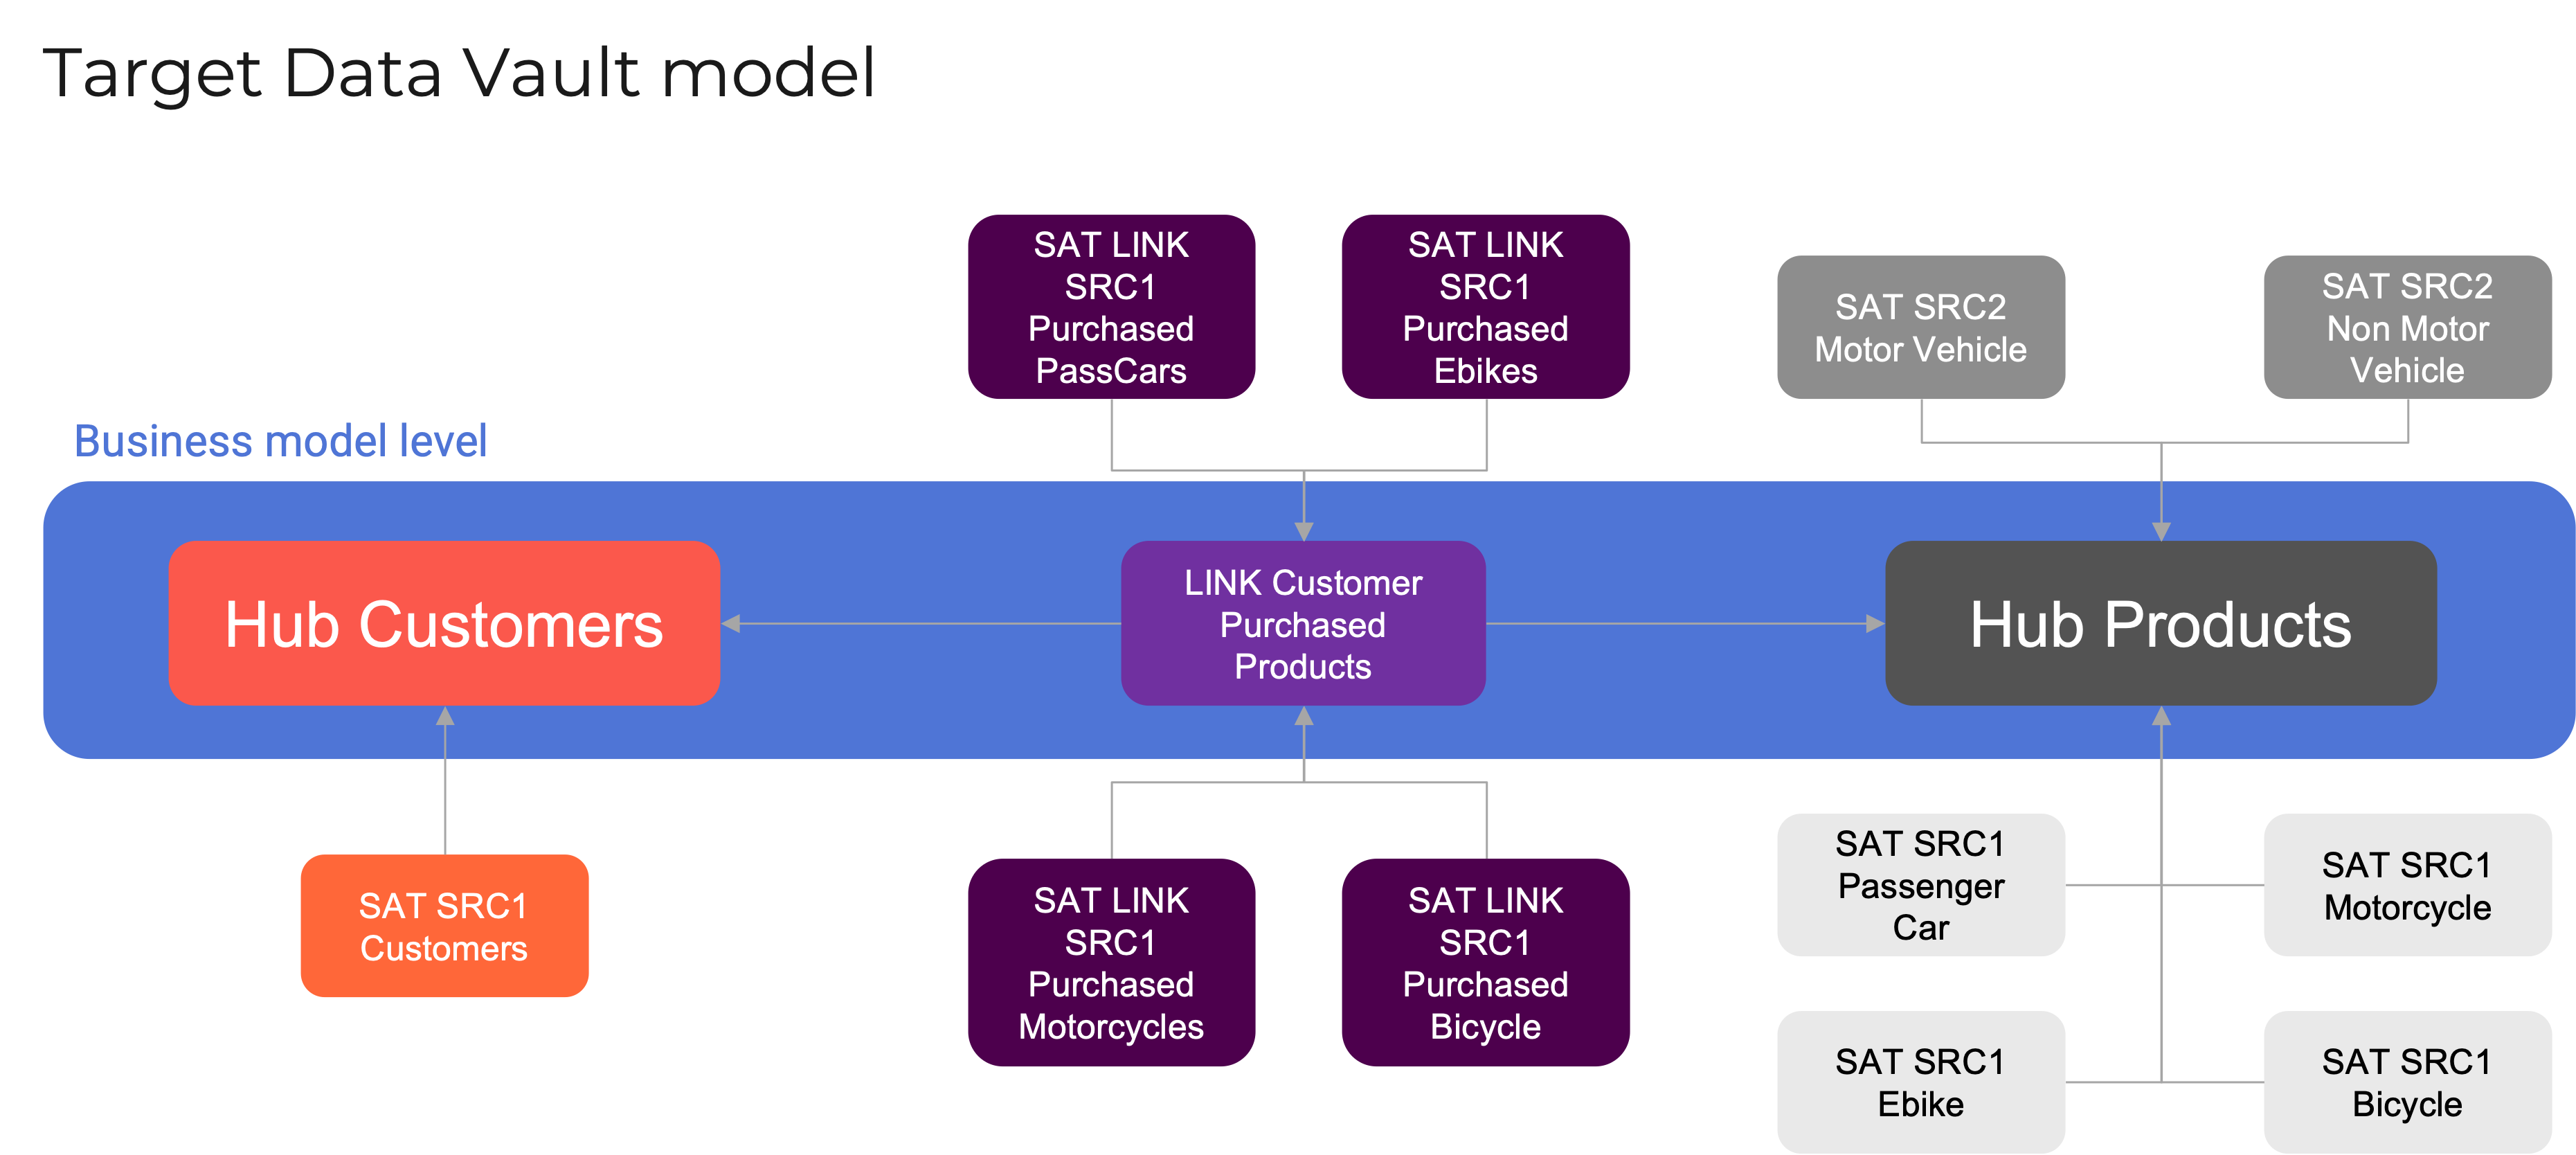
The purchase relationship captures the interaction between customers and the products they buy. This conceptual model is deliberately aligned with business requirements, ensuring relevance for reporting and analysis. Business users have selected specific taxonomy levels to reflect this alignment: the product hierarchy centers on products, while the party hierarchy focuses on customers. These selected levels form what we refer to as the business model level.
Conceptual model at business model level
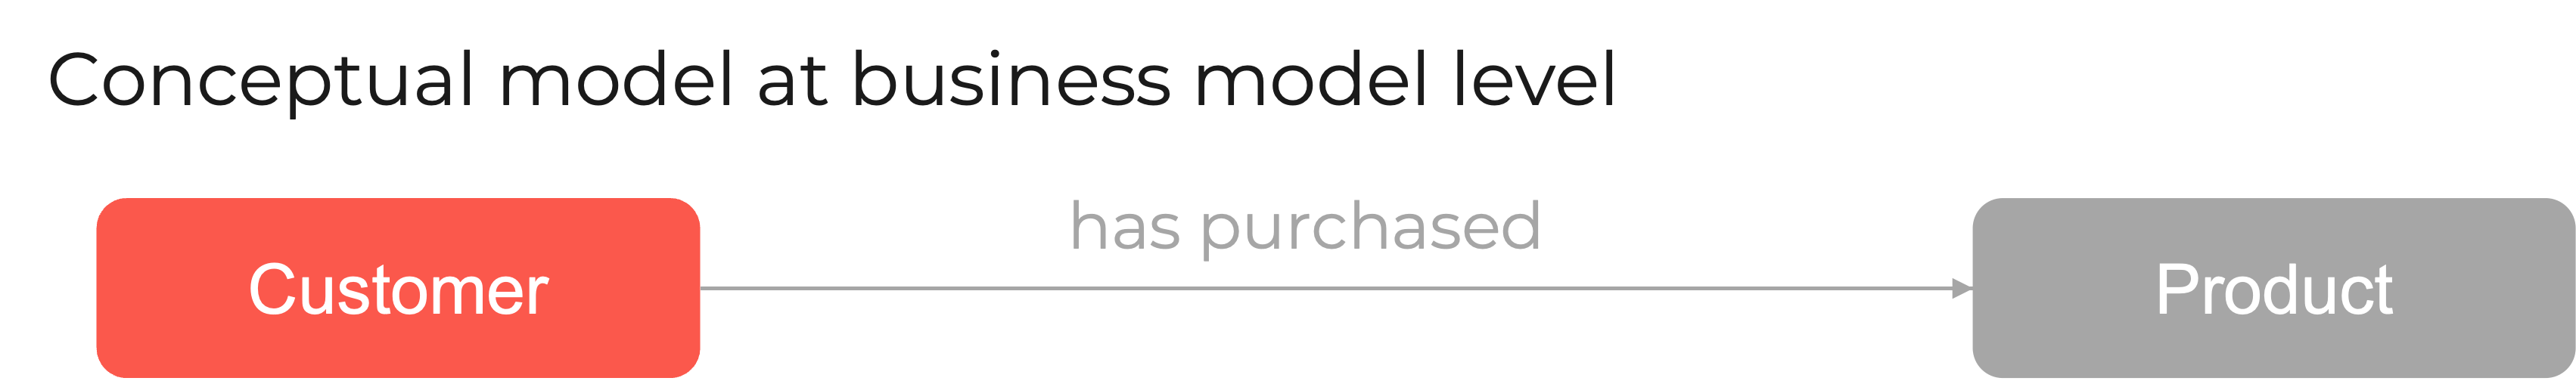
Picture 6
The master data supporting these taxonomies comes from multiple sources and is distributed across different taxonomy levels—this is known as the source model level. This master data may be maintained and replicated from a single authoritative source (a single-master system) or from several sources (a multi-master setup).
In our example, we’re working with two distinct source systems from different subsidiaries. Each uses a product taxonomy at a different level of granularity. The dealership’s goal is to analyze residential customer purchase behavior at the individual level.
Let’s now examine the source data models and how each system implements product and party taxonomies.
SRC1
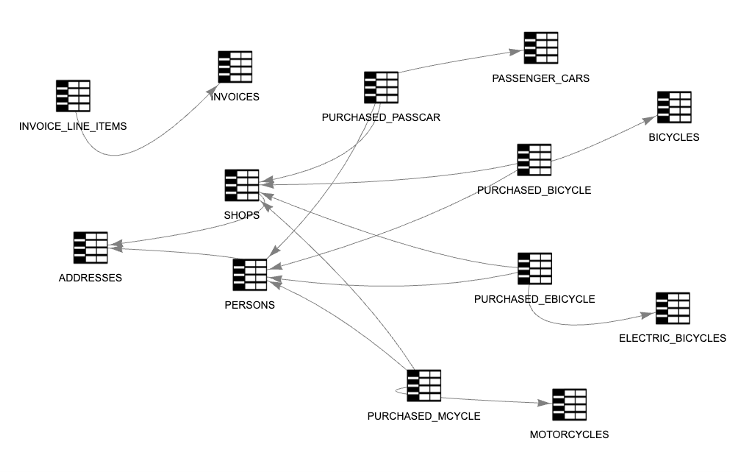
Picture 7
Picture 8
To support the business goal of reporting at level 1 of the product taxonomy (shown in blue), we need to roll up data from level 3 in the source. This requires moving upward through the taxonomy during the transformation from source to target.
Conversely, the party taxonomy requires a drill-down. The B2C source organizes party data at level 2, while the business model requires level 3 granularity. This mismatch must be carefully addressed when building the physical target data model to ensure accurate integration and alignment.
Picture 9
The second source is an ERP (Enterprise Resource Planning) system used for inventory tracking. It contains detailed information about products and stock levels across various retail locations—but it does not include customer data.
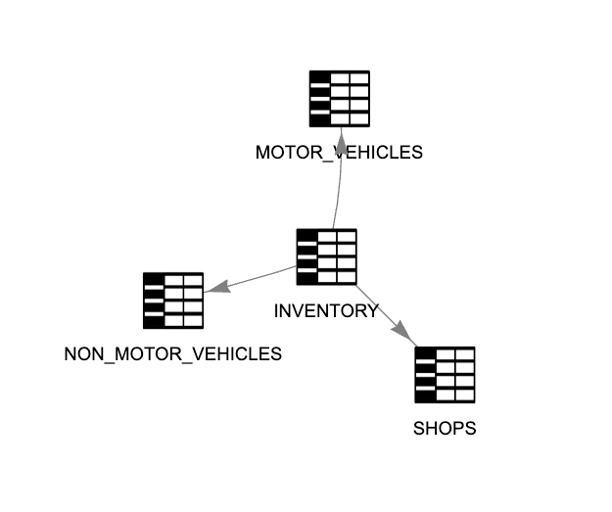
Picture 10
This source applies the product taxonomy at level 2, as shown in the following diagram. Once again, there's a mismatch between the source model level and the business model level that must be resolved during integration.
Picture 11
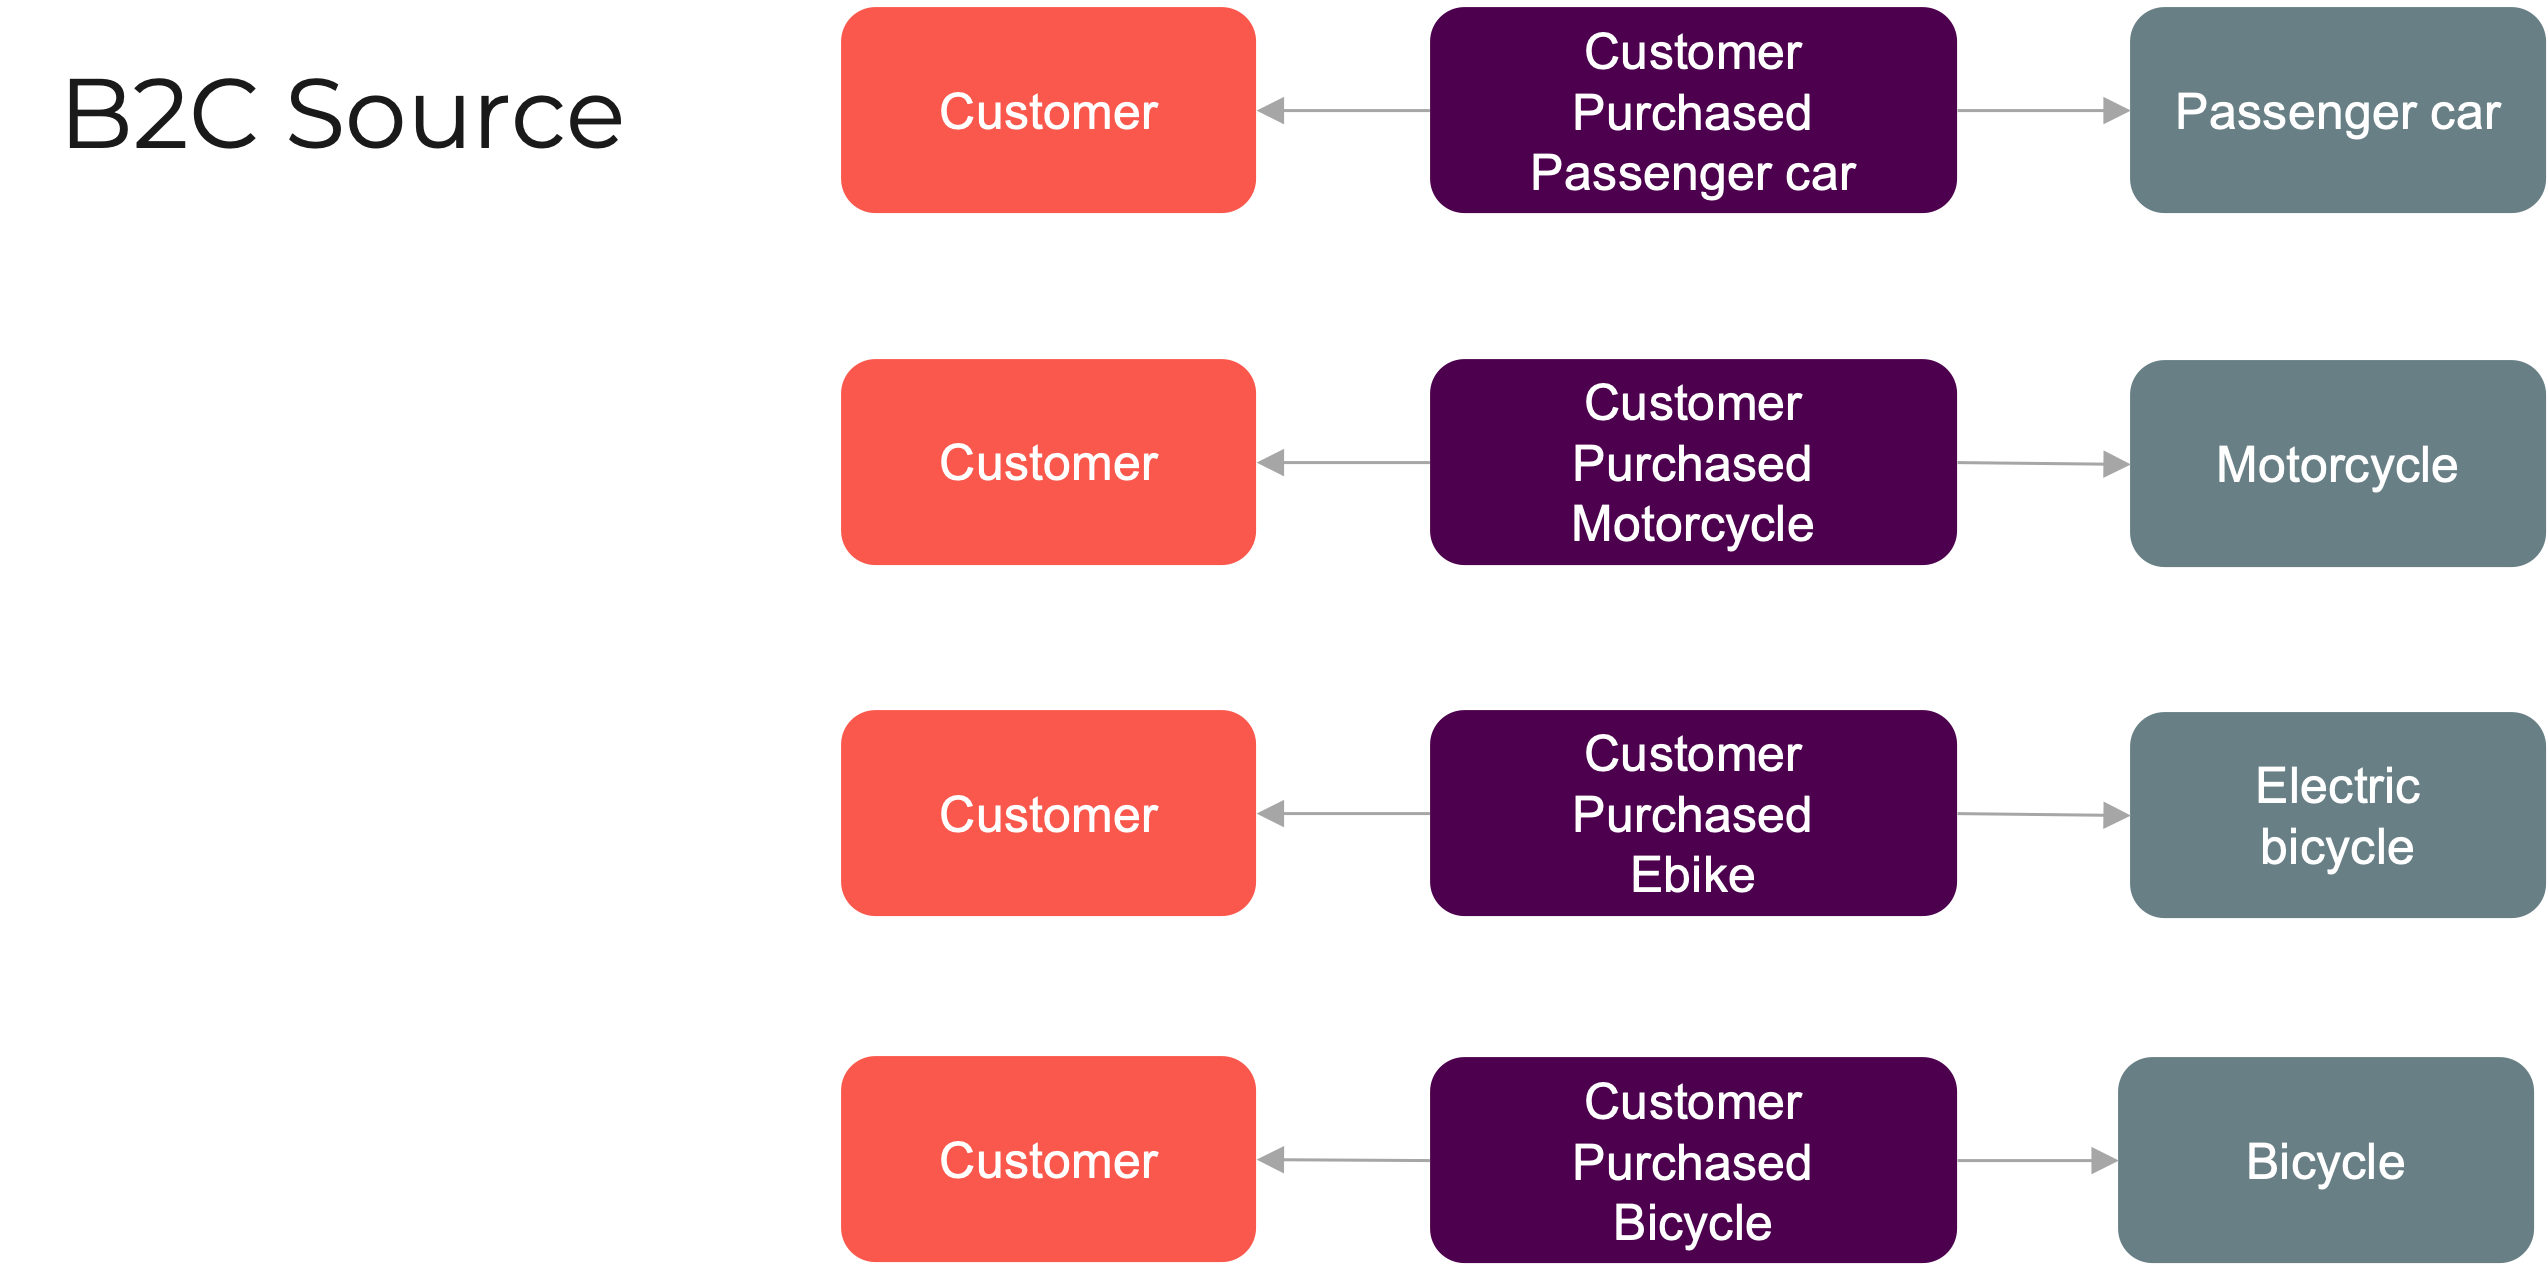
To enable meaningful reporting, it’s essential to establish a purchase relationship that links each customer to the products they’ve bought.
Within source 1, at level 3 of both the party and product taxonomies, four many-to-many relationships emerge (see Picture 12).
This dealership example has illustrated how a conceptual business model maps to the physical structures found in source systems. It also highlights the challenges of integrating these models into a unified data warehouse design.
In the next chapter, we’ll explore how to accomplish that integration using Data Vault—a data modeling methodology purpose-built for this task. Data Vault stands out as the only approach that combines high levels of standardization with the flexibility needed to support evolving business needs.
Picture 12
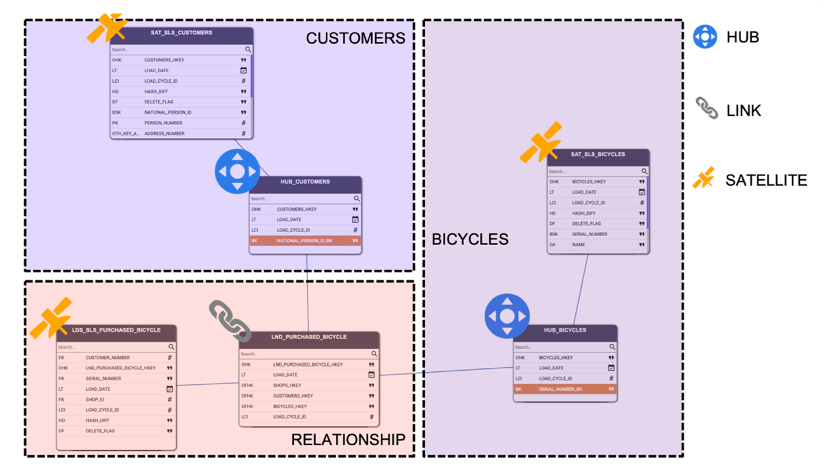
Picture 13
Picture 13
The diagram illustrates three core concepts: customers, bicycles, and the historical relationship between them. Each concept maps cleanly to Data Vault structures:
- Customers and bicycles are treated as business objects, captured by the HUB_CUSTOMER and HUB_BICYCLE, respectively.
- The purchase relationship between them is modeled as a link connecting the two hubs.
- Descriptive details, such as customer attributes, are stored in satellites, like SAT_SLS_CUSTOMERS.
These three components—hubs, links, and satellites—enable the integration and harmonization of diverse data inputs, regardless of how they are classified in the source.
Importantly, Data Vault is also well equipped to handle multiple classifications of the same entity when they appear at different levels across various sources—a challenge that traditional models often struggle to address.
Importantly, Data Vault is also well equipped to handle multiple classifications of the same entity when they appear at different levels across various sources—a challenge that traditional models often struggle to address.
Data Vault architecture
Data Vault is more than just a modeling technique—it’s also a reference architecture purpose-built to manage the integration, aggregation, and consolidation of diverse source data models, taxonomies, and naming conventions. It is specifically designed to address and simplify the inherent complexity of these tasks.
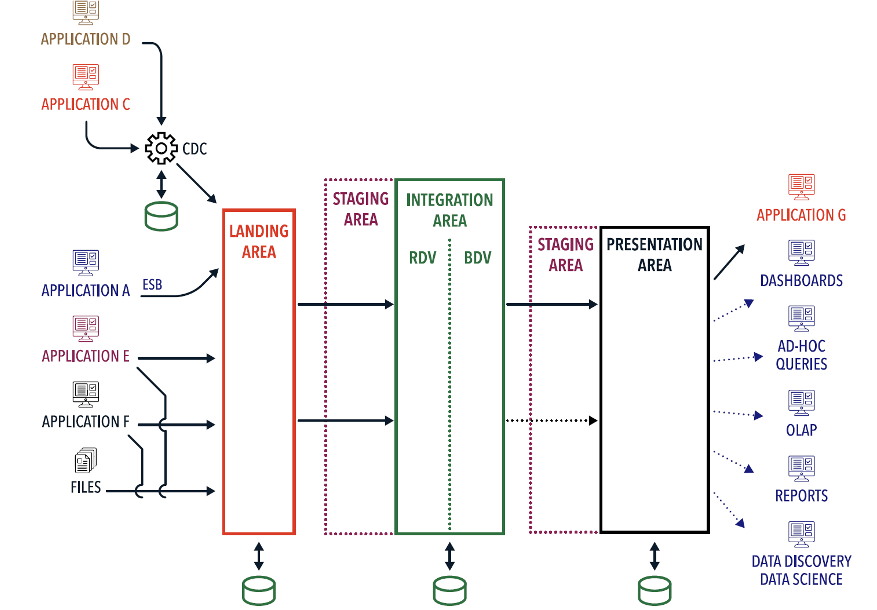
Picture 14
The first layer of the Data Vault architecture is the landing area, which captures data from source systems. Data can arrive through change data capture (CDC), real-time enterprise service buses (ESBs), direct database connections, or file-based ingestion.
Next is the integration area, which includes two internal layers:
- Raw Data Vault (RDV) – stores unmodified, historical data exactly as it comes from the source systems. This layer preserves source truth and serves as the factual record of what exists or has occurred.
- Business Data Vault (BDV) – contains pre-processed data and applies additional business logic. It aligns business keys and terms with the target model to ensure consistency, compliance, and semantic clarity across the integrated dataset.
The key distinction: RDV focuses on unfiltered, raw source data, while BDV refines and contextualizes that data for analytical use...
Both the Raw and Business Data Vault layers are modeled using standard Data Vault constructs: hubs, links, and satellites.
The third layer in the architecture is the presentation layer, which delivers information to downstream applications—such as dashboards, reports, and analytical tools—via information marts. These marts can reflect multiple business perspectives on the same data, all coexisting within the architecture. Each view is treated as a valid interpretation, tailored to specific reporting or analytical needs.
Importantly, the stability of artifacts varies across layers. While raw data in the RDV remains consistent over time, business perspectives in the BDV—complete with embedded rules—tend to evolve as the organization adapts to changing market conditions and requirements.
Data Vault also supports multi-temporal solutions. It not only provides standardized design patterns for managing multiple timelines, but also enables users to define and switch between them as needed—offering maximum temporal flexibility.
Beyond these core layers, Data Vault architecture provides several operational advantages:
- It enables distributed deployments, allowing an enterprise data warehouse, lakehouse, or mesh to span across clouds or geographic regions in multi-cloud setups.
- It supports hybrid environments, bridging on-premises and cloud systems seamlessly.
- It delivers full auditability, allowing every record to be traced back to its source and every report to be fully reconstructed.
- It accommodates granular security patterns, including cell-level access controls and GDPR-compliant data deletion or reduction strategies tailored to specific data needs.
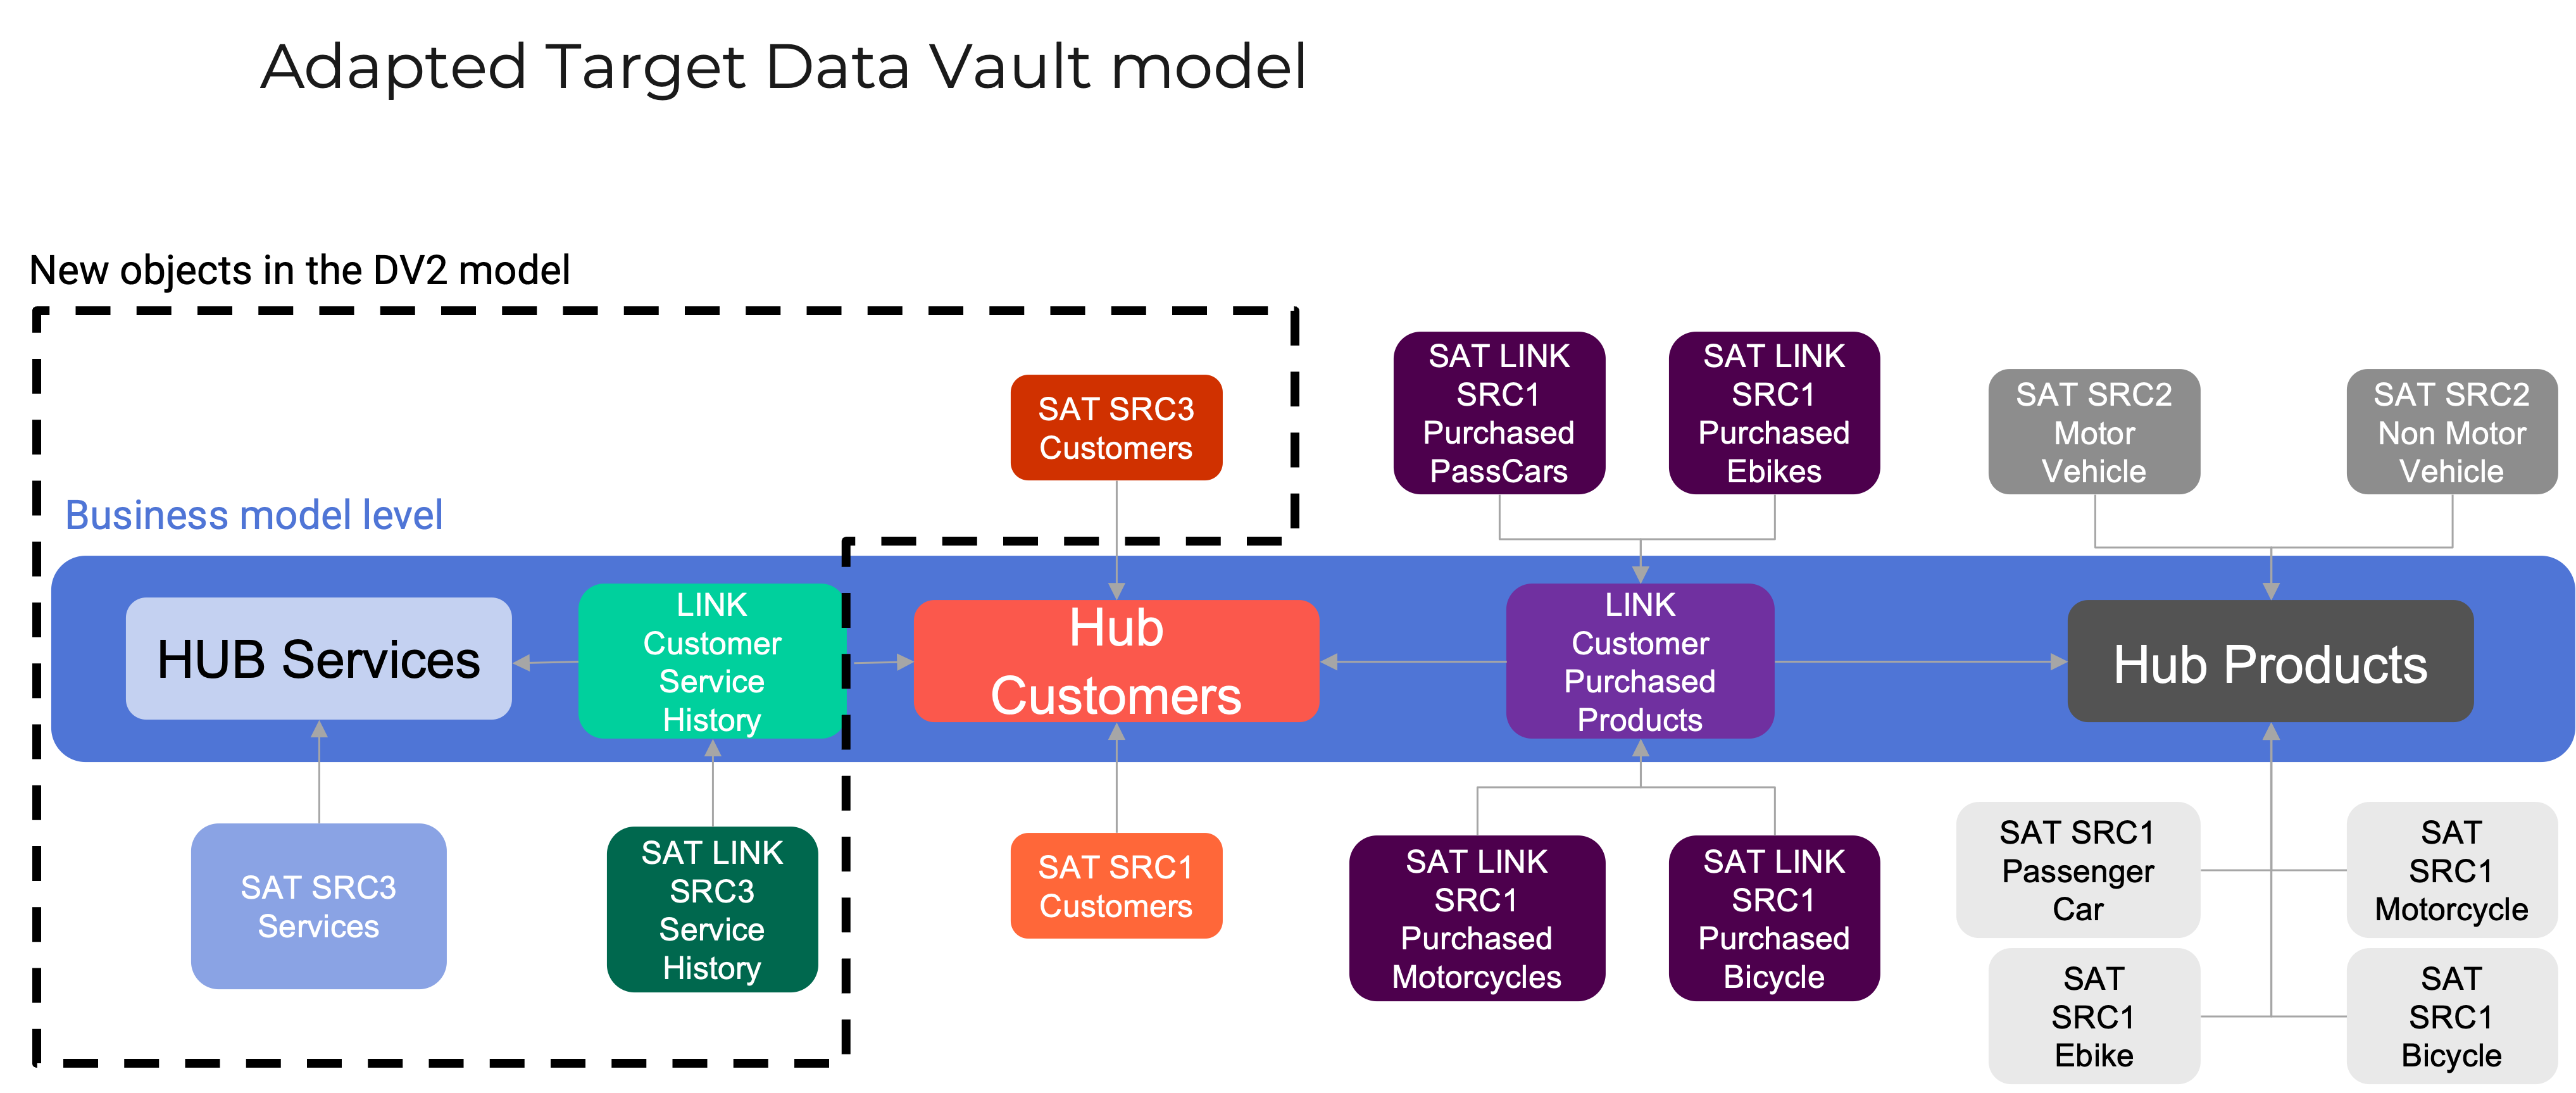
Returning to our dealership example: the source models we explored can now be transformed into a Data Vault model. As intended, this target model should closely reflect the business conceptual model while ensuring that data from all relevant sources is accurately captured and integrated...
Picture 15
Picture 16
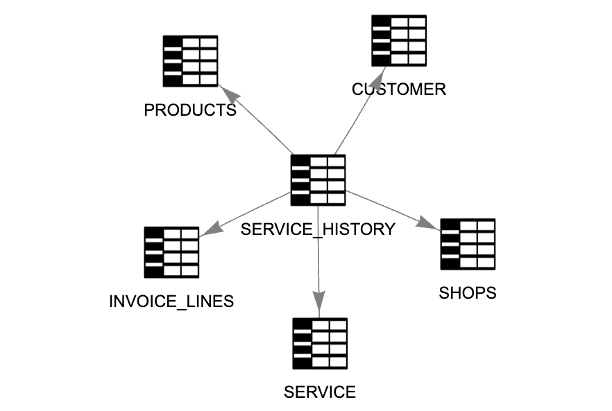
Source 3 introduces a new concept: services. To determine how best to integrate this concept into the existing business model, it’s essential to consult with key stakeholders across the organization.
There are two potential modeling approaches:1. Treat services as another type of product and integrate them into the existing product hub
2. Recognize that services and products are fundamentally different and create a dedicated service hub
Given that services are managed by a separate sales team and follow a different customer journey timeline, the second option is more appropriate. As a result, the business model is updated to reflect both products and services as distinct concepts—each positioned at the second level of the revised taxonomy..
Picture 17
Picture 18
Automating multi-source data integration
We’ve established that Data Vault helps overcome the complexity of integrating multiple data sources and taxonomies into a unified target model. But when enterprises begin working with 20 or more sources, manual integration becomes a serious bottleneck.
Two major challenges emerge:
- It becomes virtually impossible to manually construct a complete conceptual or target model.
- Managing integration across multiple source systems, technologies, and data types becomes unmanageable at scale.
This is where data automation becomes essential.
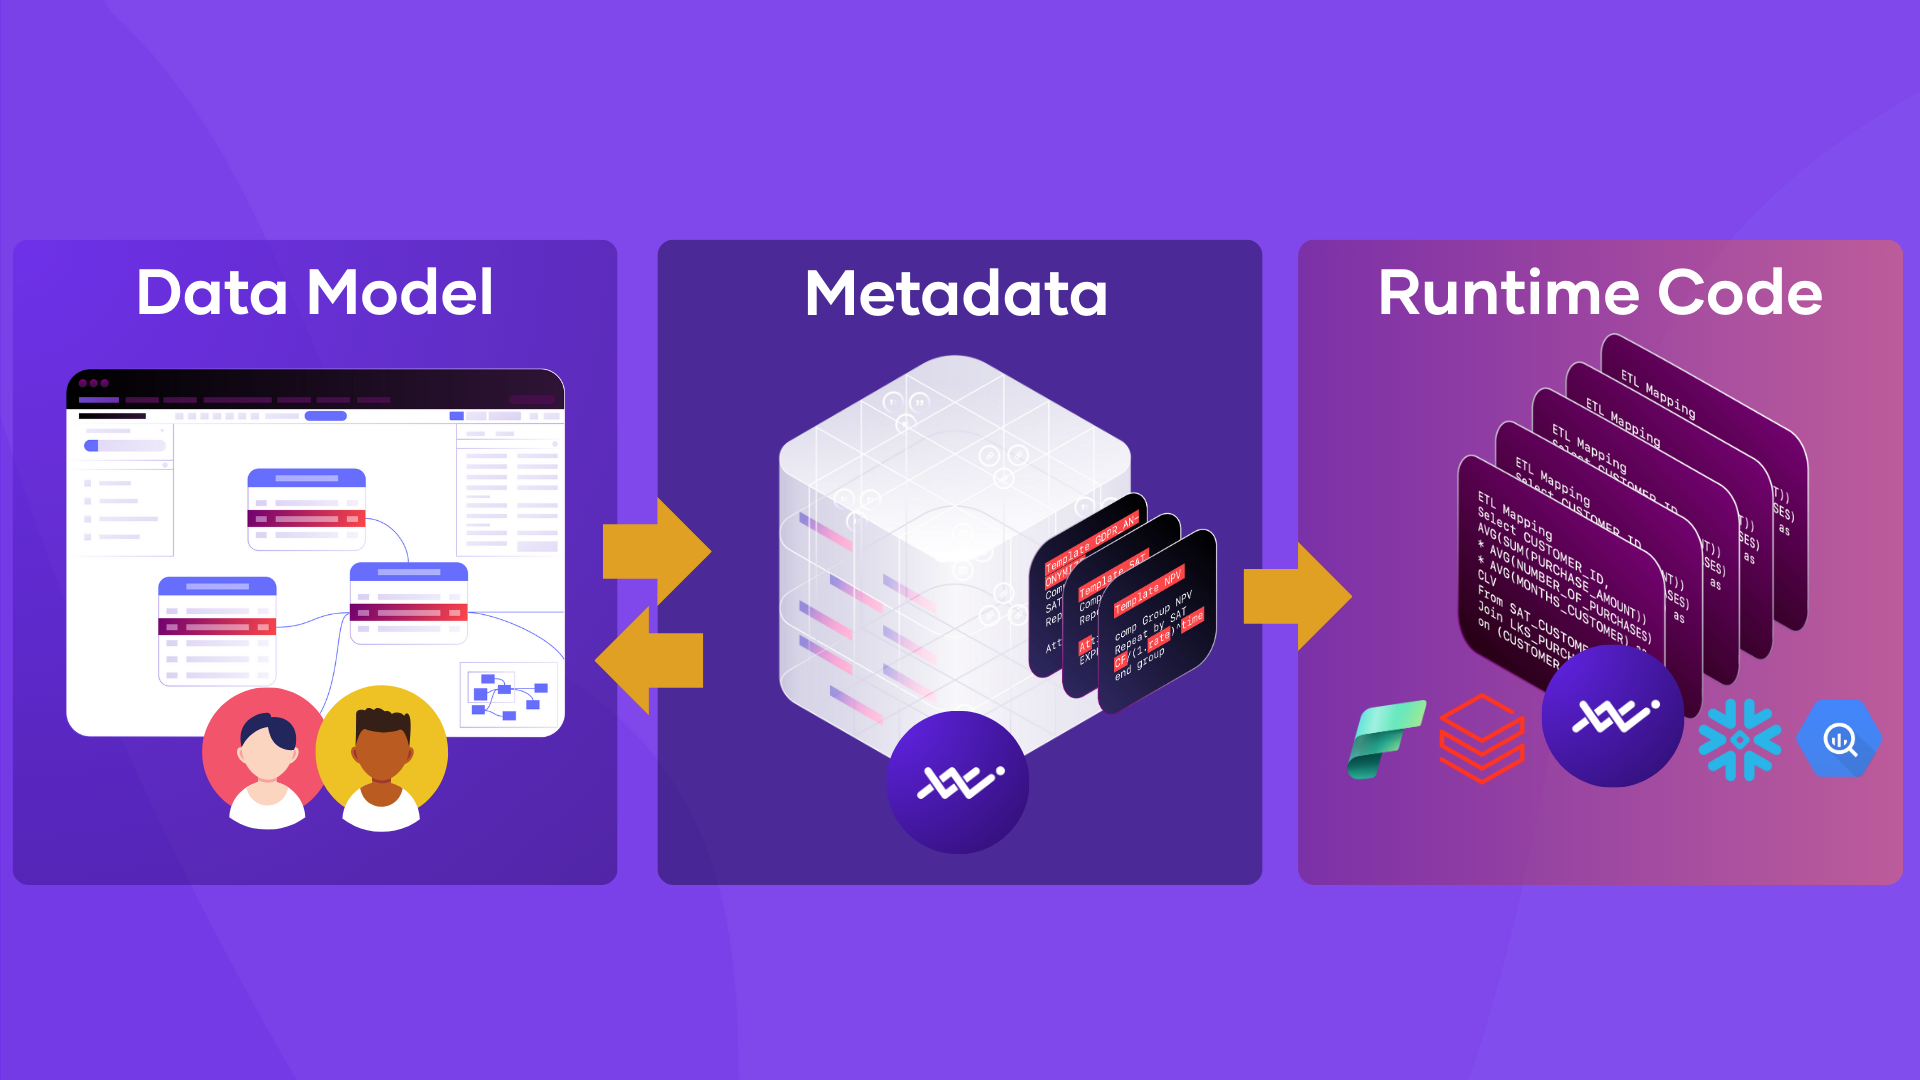
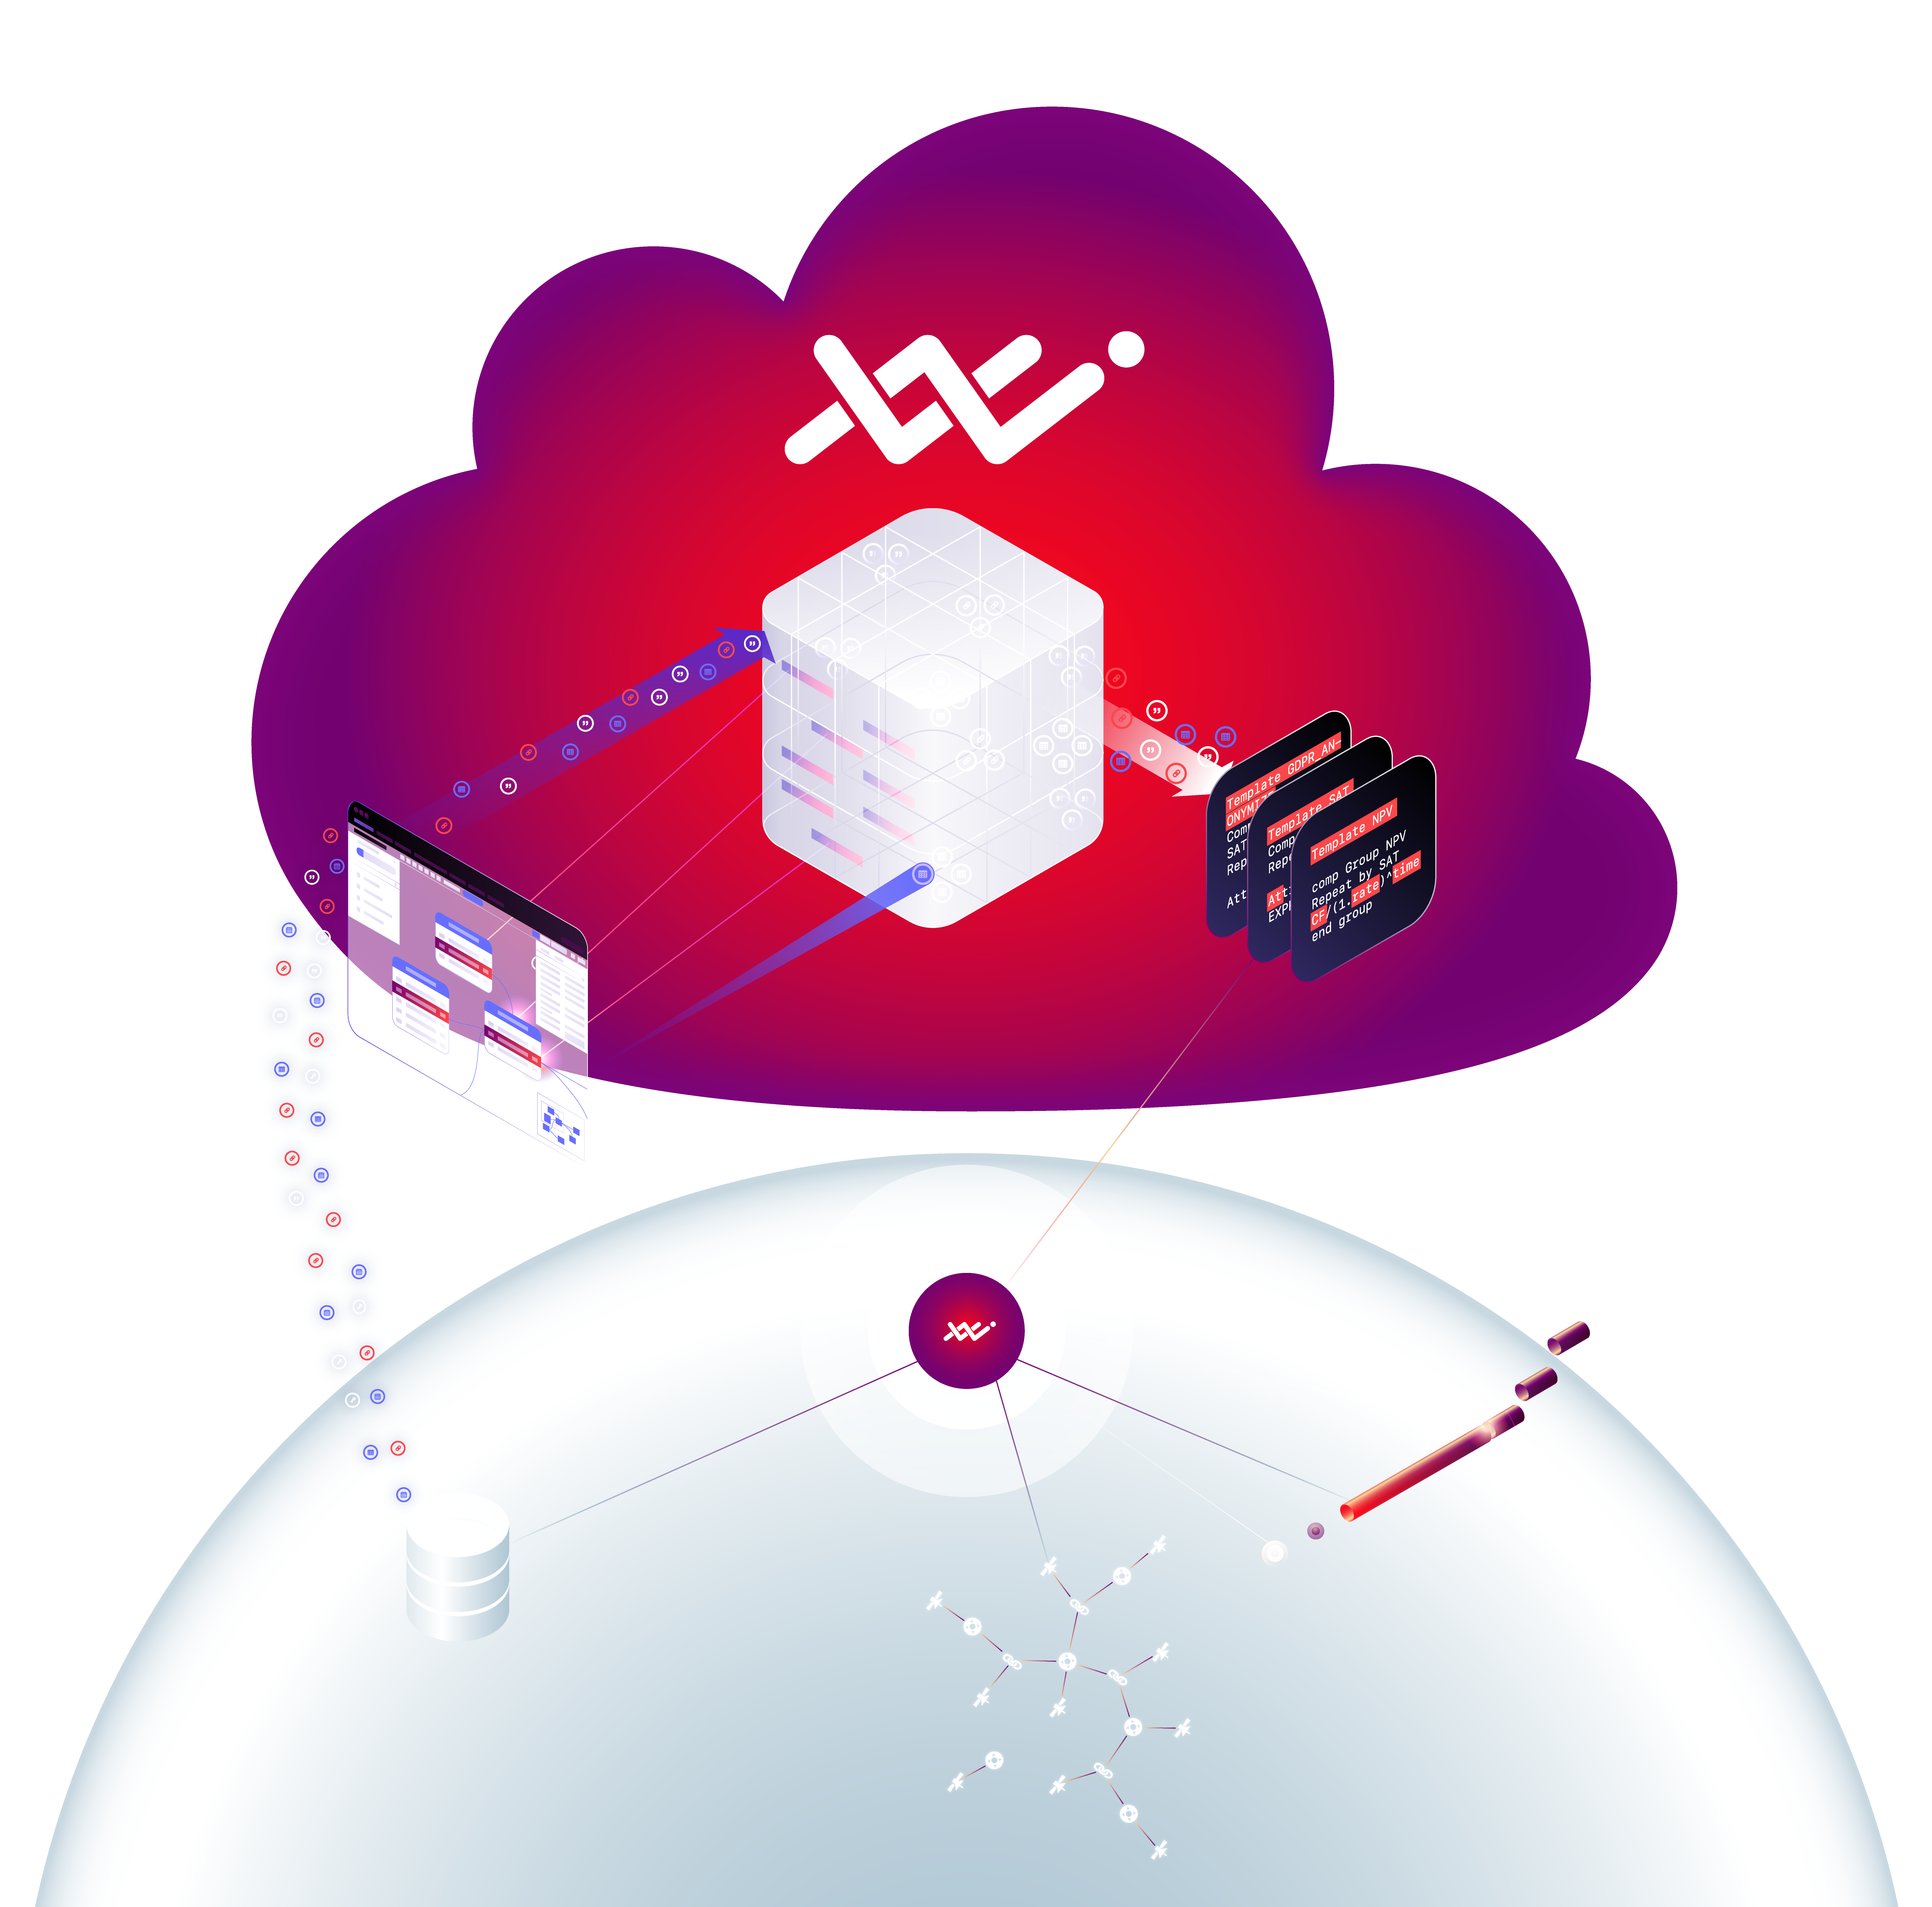
Automation enables organizations to manage the vast volume of datasets by collecting large amounts of source metadata and enriching it—turning it into valuable, actionable input. The more metadata the system can process, the more scalable and intelligent the automation becomes. Think of it as upgrading from a copper UTP cable to fiber optics: same principles, exponentially greater speed and bandwidth.In terms of output, automation covers three key areas:
- The physical target data model – typically expressed as DDL (Data Definition Language) statements, also known as the relational model
- The integration logic – the DML (Data Manipulation Language) code that transforms and loads data from source to target
- The workflow orchestration – Python or equivalent scripts to schedule and manage the data pipelines
Without automation, productivity slows dramatically—but even more critically, consistency suffers. In data warehousing, quality is defined not by absolute precision, but by adherence to expected patterns. There are only a limited number of repeatable patterns for producing hubs, links, and satellites. Deviating from these patterns increases documentation effort, testing complexity, and ultimately, the risk of failure.
However, before automation can be effectively applied, a few prerequisites must be in place:
1. Single-function object types
Each object type must serve a single, well-defined purpose. The more functions an object performs, the more complex and variable the loading patterns become—reducing repeatability and limiting the value of automation. Data Vault meets this requirement perfectly: hubs, links, and satellites are designed with only one or two functions, making them ideal for automation.
2. Clear mapping between source and target
A reliable automation process depends on an unambiguous relationship between the source data and its representation in the target model. In Data Vault, this is achieved through the Raw Data Vault layer, which stores the Single Version of the Facts—the raw, unaltered data as it exists in the source systems.
3. Sufficient level of abstraction
Automation works best at an abstract level—not at the physical layer where implementation details vary widely. Data Vault supports this abstraction through its use of standardized object and attribute types (e.g., hubs, links, satellites, business keys, and historical attributes). These standardized components—referred to as signature objects and attributes—enable the development of reusable, pattern-based automation logic (as illustrated in Picture 20).
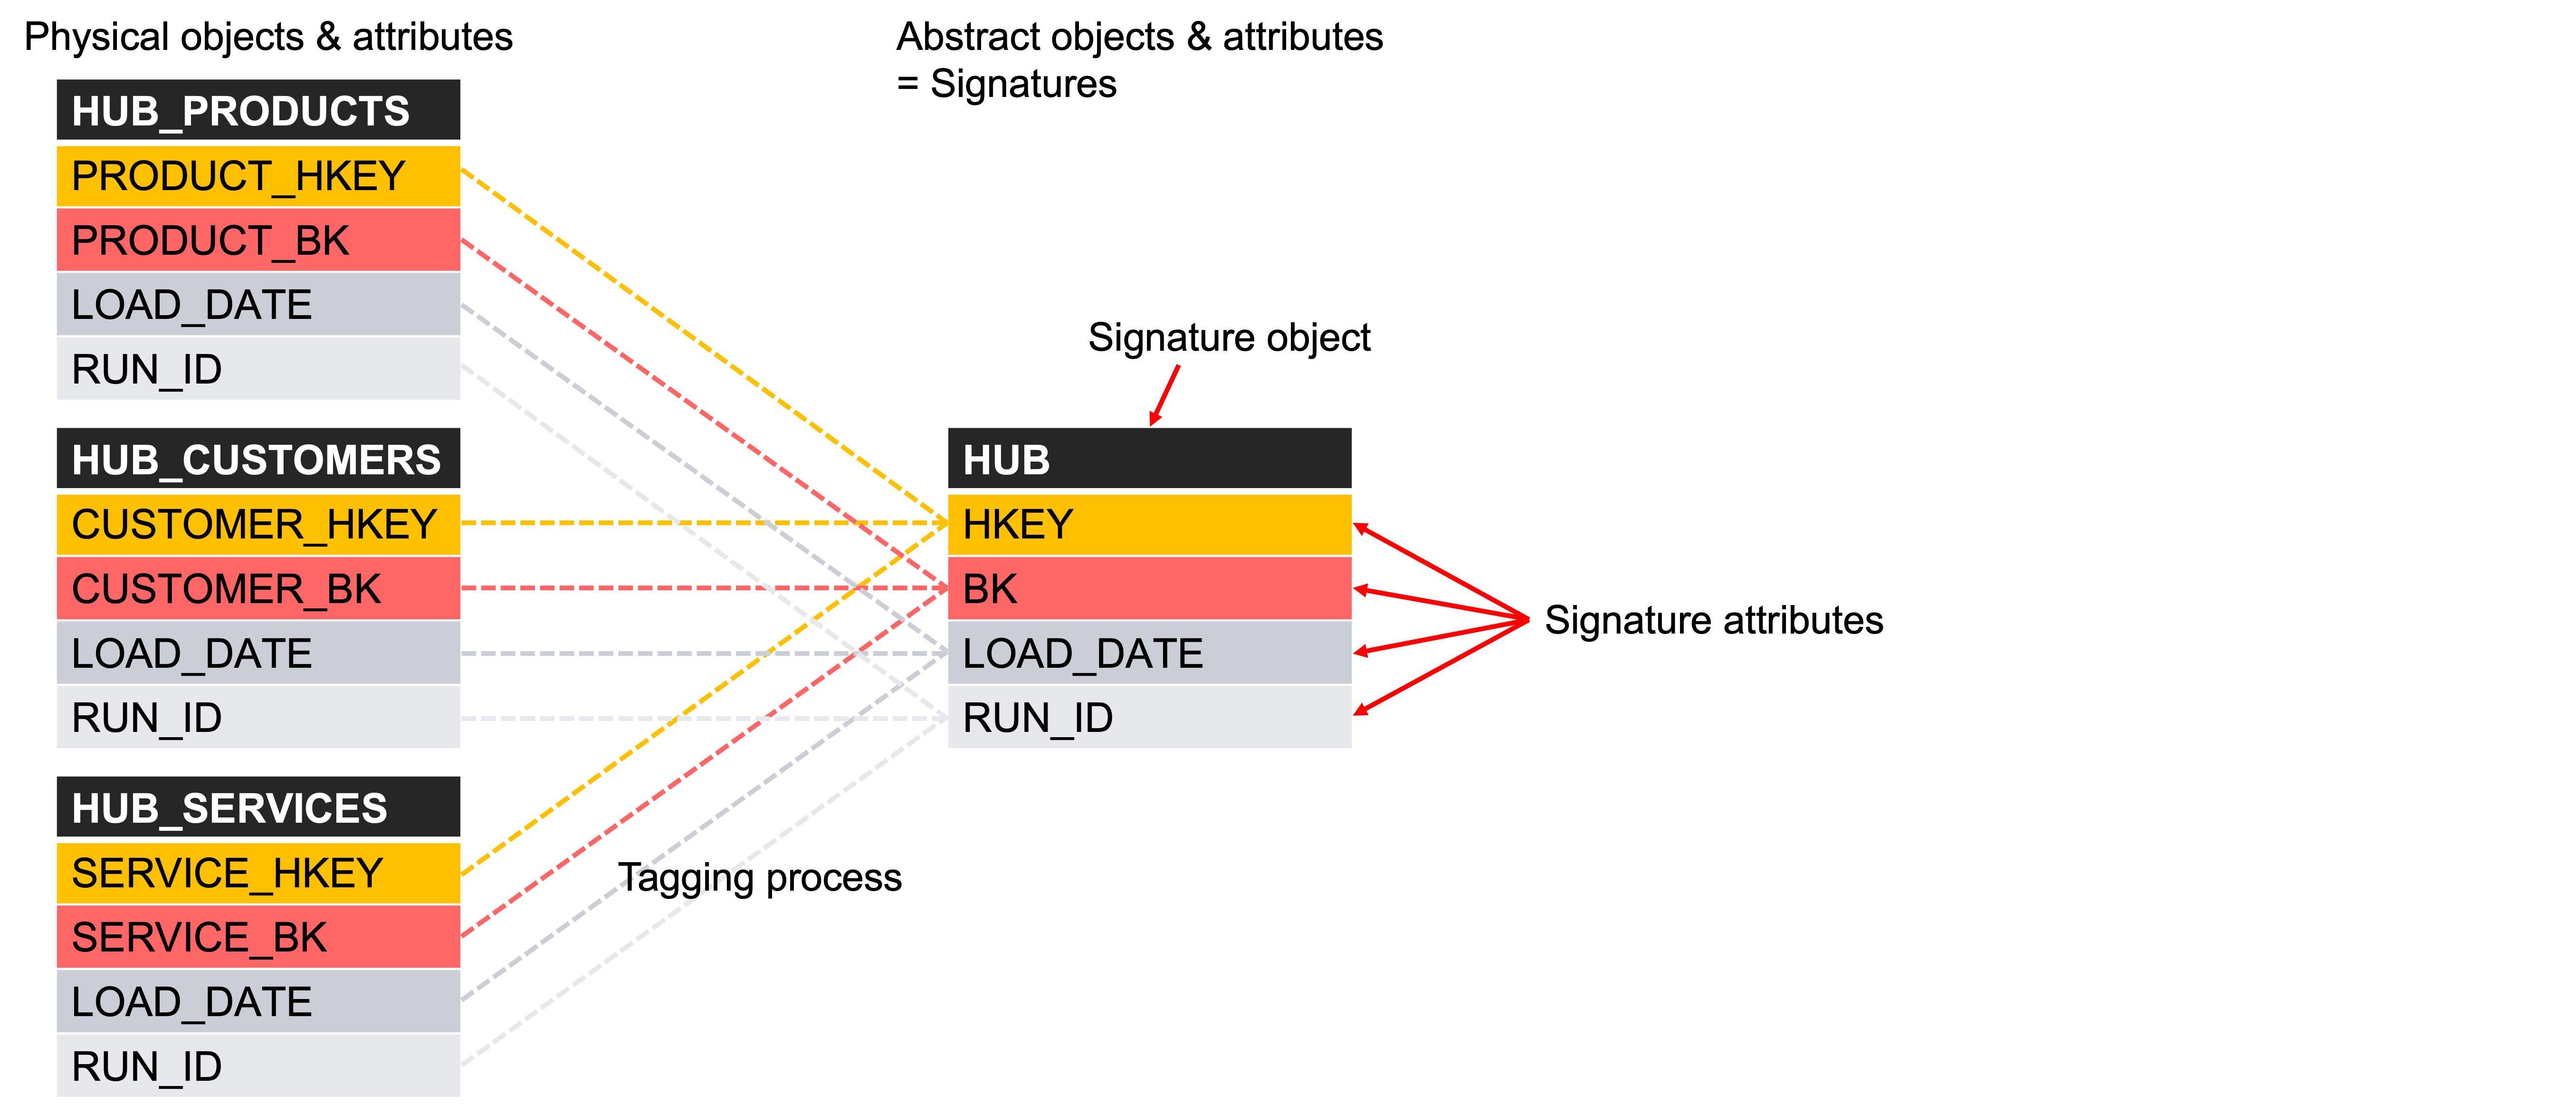
Picture 19
So, what is the data transformation equivalent of a fiber optic cable?
The answer lies in combining three essential components:
1. A smart metadata repository
2. Built-in automation templates
3. A robust Graphical User Interface (GUI) for intuitive data modeling
When properly configured, these components form a high-throughput, low-friction system for enterprise-scale data transformation.
In the next chapter, we’ll show how these elements come together in practice—using our dealership example to illustrate how VaultSpeed brings this architecture to life.
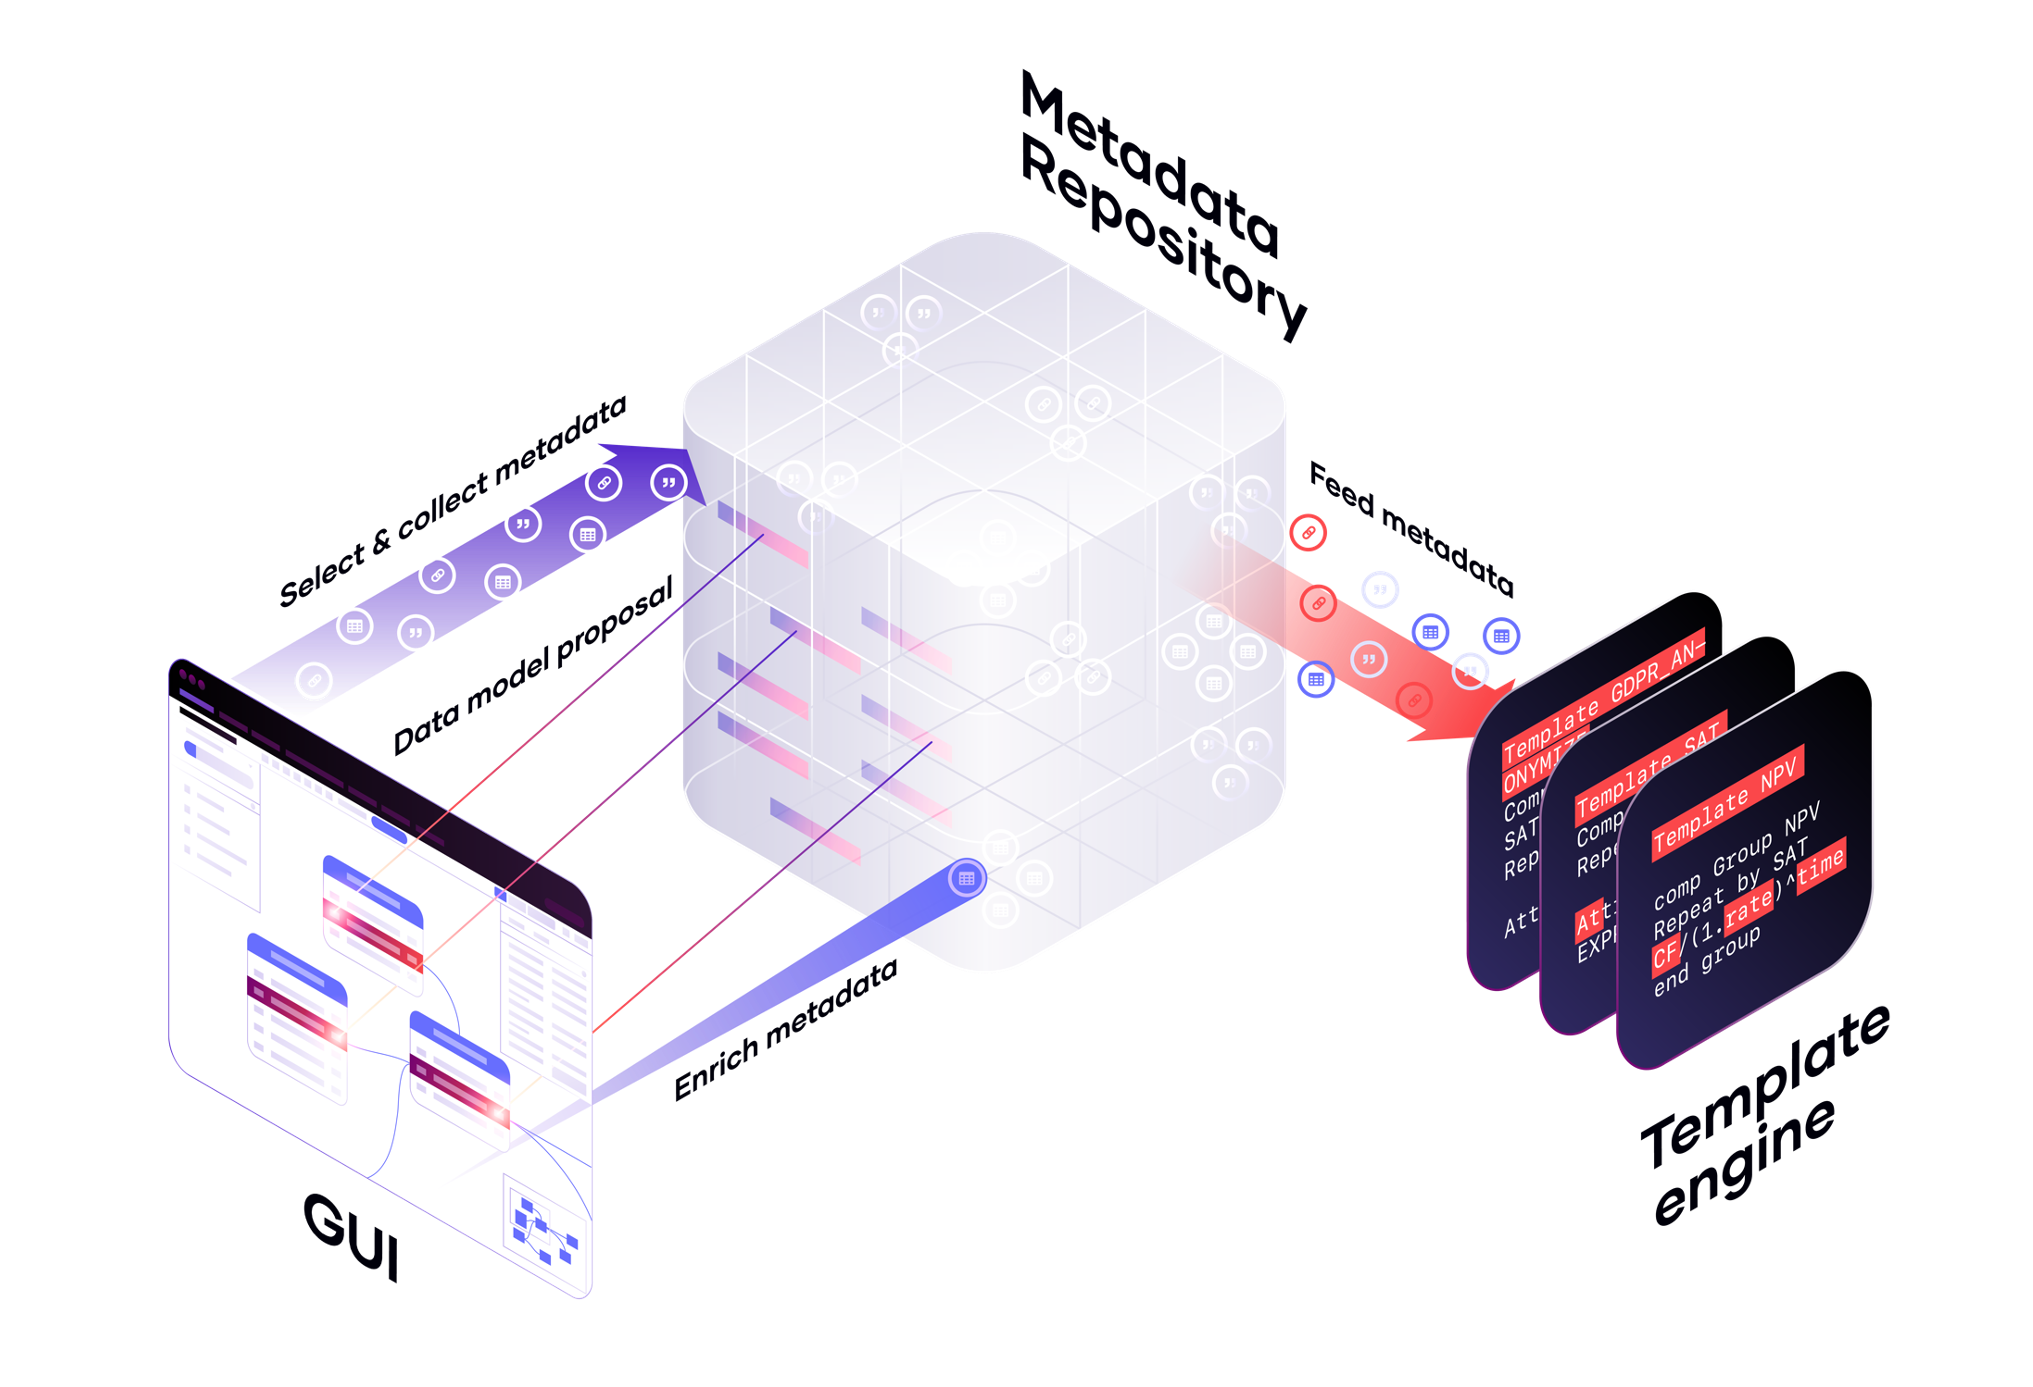
Picture 20
Picture 21
In this example:
- Data Source src1: the source that captured B2C sales data - as shown in Picture 7
- Data Source src2: ERP source containing inventory data - as shown in Picture 10
- Data Source src3: relating to the service operations - as shown in Picture 16
The harvested metadata is securely stored in a smart metadata repository, which serves as the foundation for automation. Within this repository, metadata can be organized into signature groups—collections that apply across multiple levels, including schema, object, and attribute.
These groups enable abstraction across different physical structures by classifying elements based on their role or business meaning. For example, the Data Vault standard defines common signature types such as hubs and business keys. You can also define custom, business-driven signature groups—such as one that flags all attributes containing GDPR-sensitive data (as shown in Picture 22)..
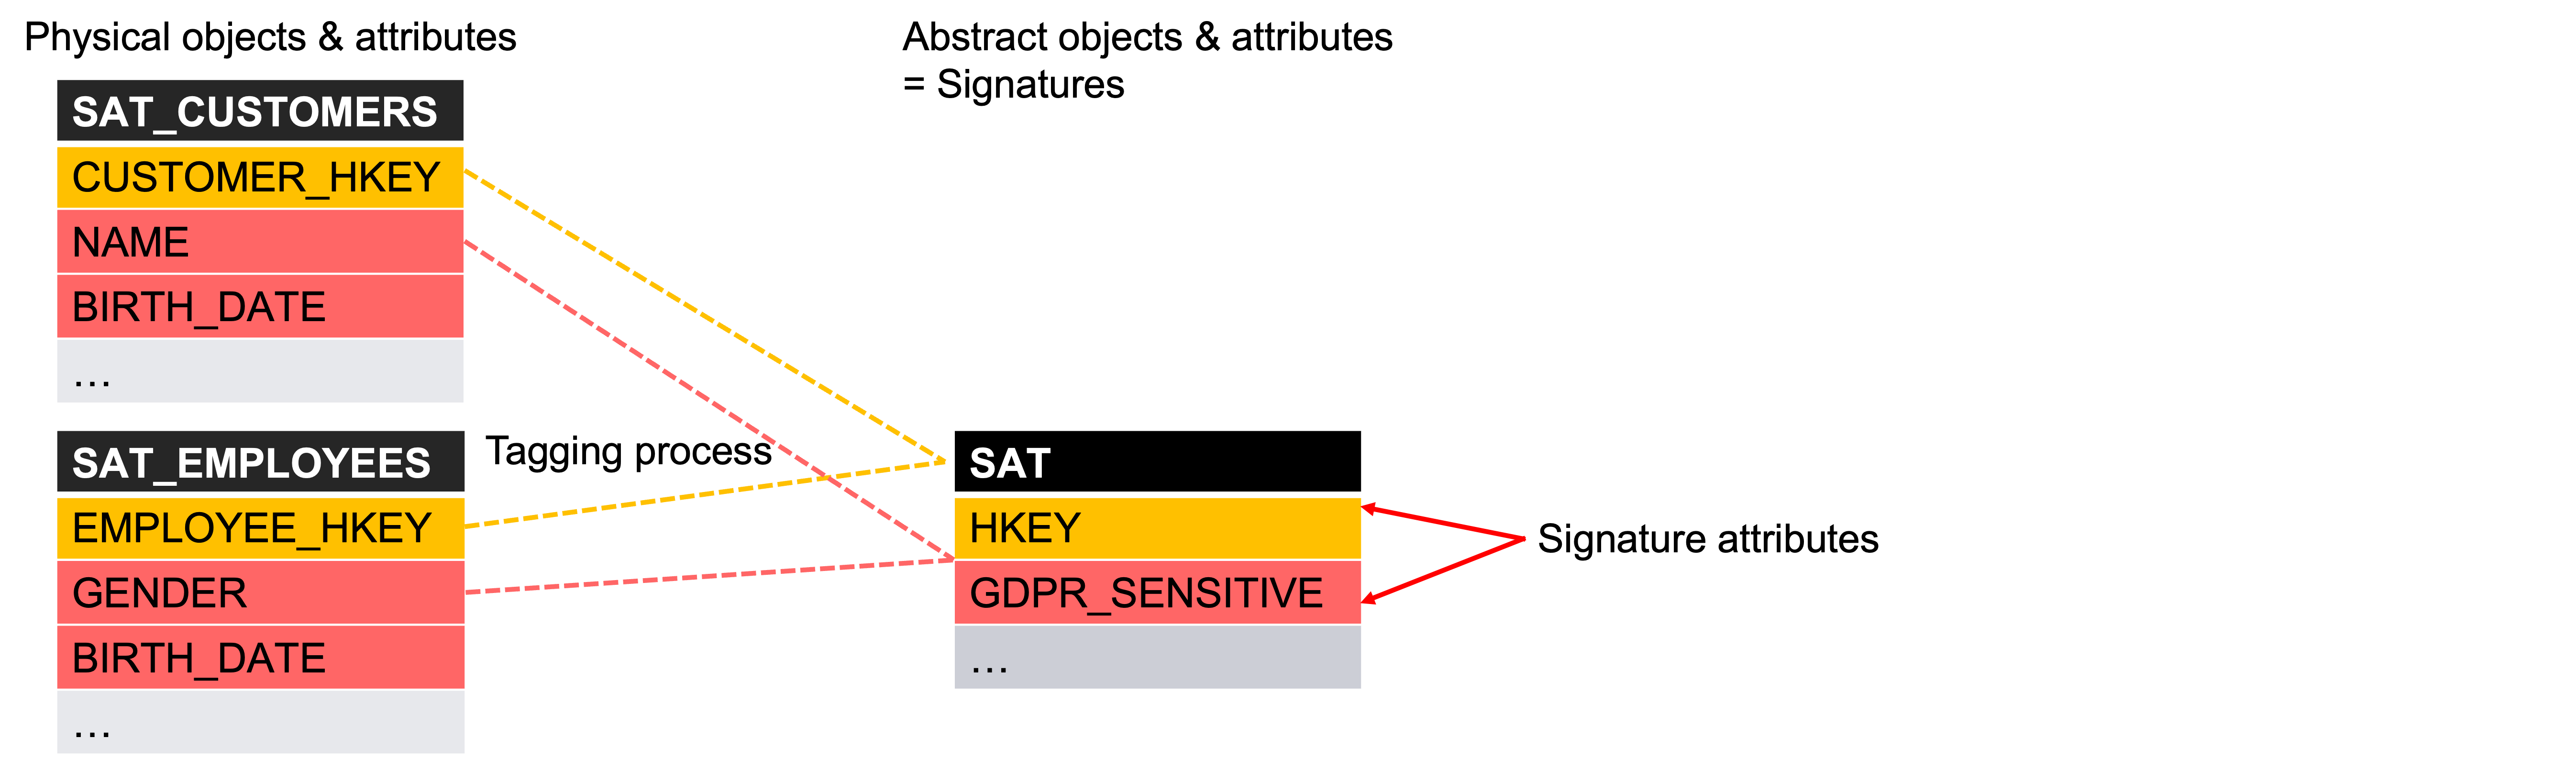
Picture 22
Signature tagging acts as the crucial link between the physical structure of source systems and the abstract logic required for automation. It enables the use of repeatable logic across datasets, regardless of their origin.
This logic is applied through automation templates, which drive consistency and efficiency. These templates support a broad range of use cases:
- Data integration logic (e.g., implementing Data Vault structures)
- Business logic (such as calculating total vehicle sales or service revenue)
- Testing logic (like verifying if values match across systems)
Instead of relying on physical components, these templates operate on abstract signature elements, allowing automation to scale across systems and scenarios.
VaultSpeed provides pre-built Data Vault templates, eliminating the need to build and test repetitive patterns from scratch—helping teams avoid costly errors caused by incorrect automation logic.
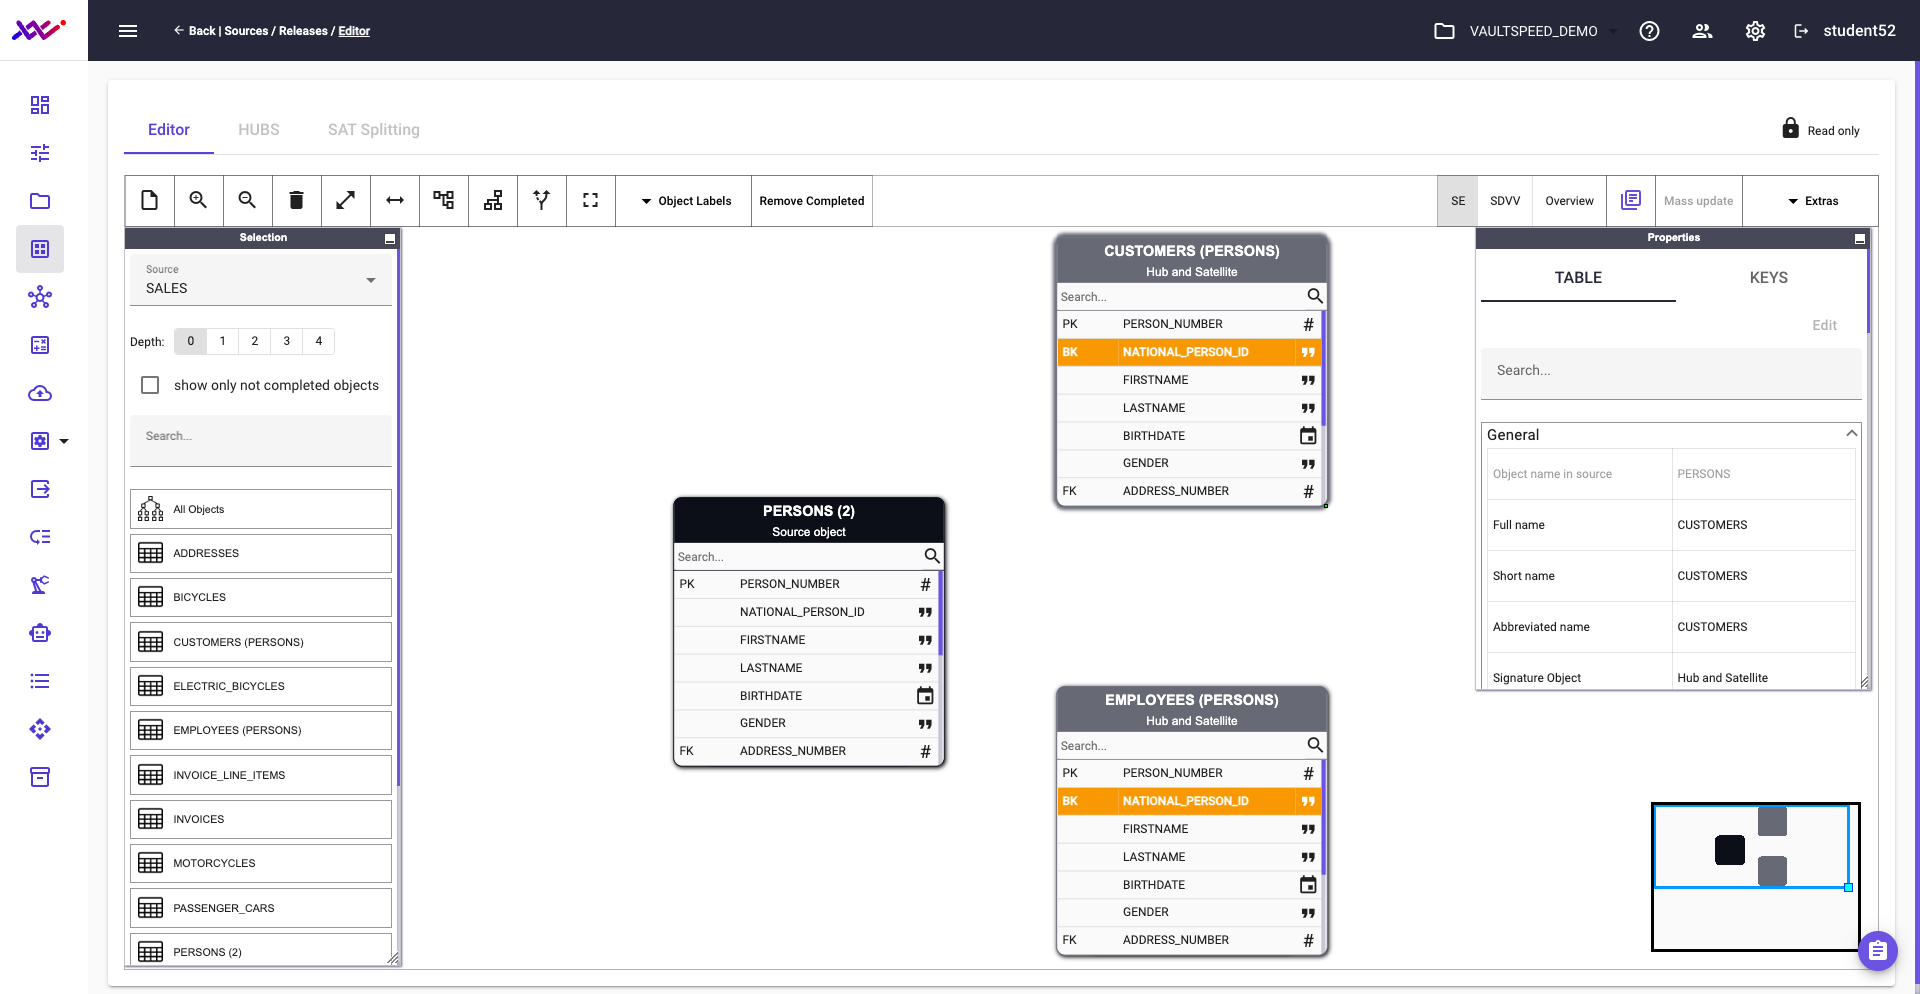
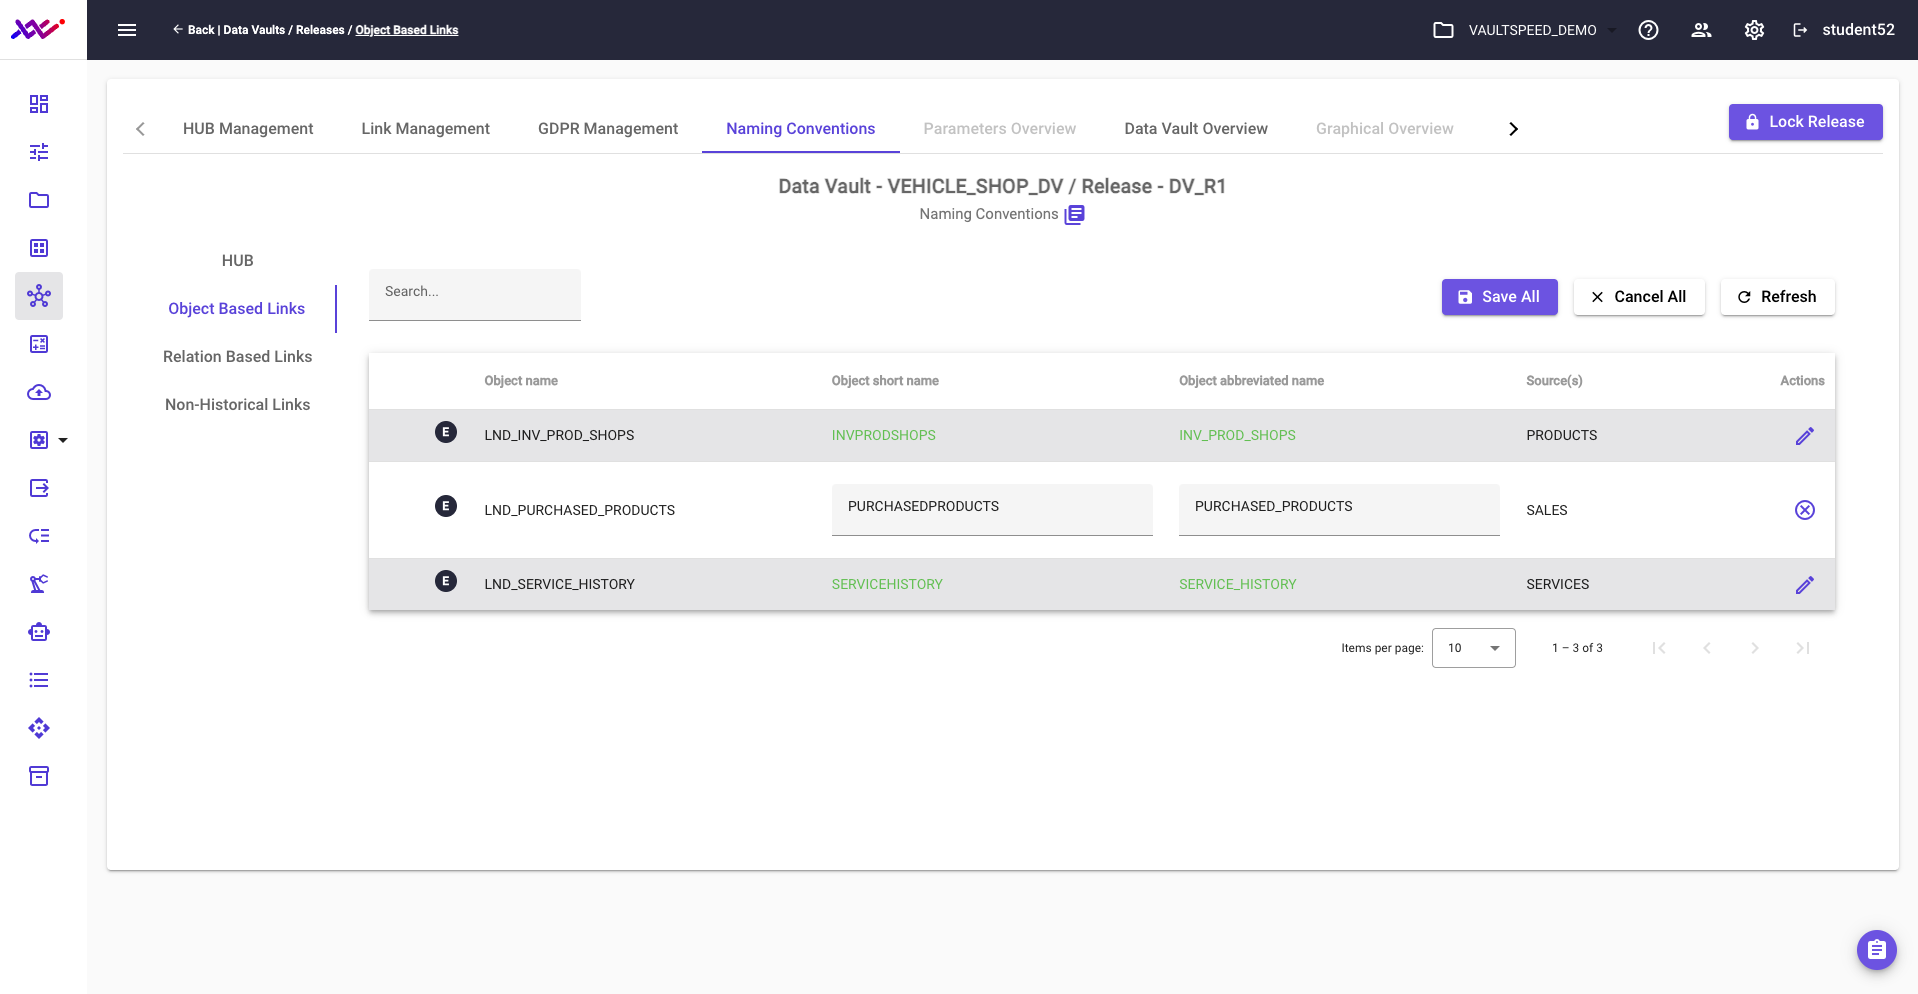
In the example below, you can see the object selection screen for our B2C source. Metadata has been automatically harvested, and users can now select the relevant source objects to be included in the integration process.
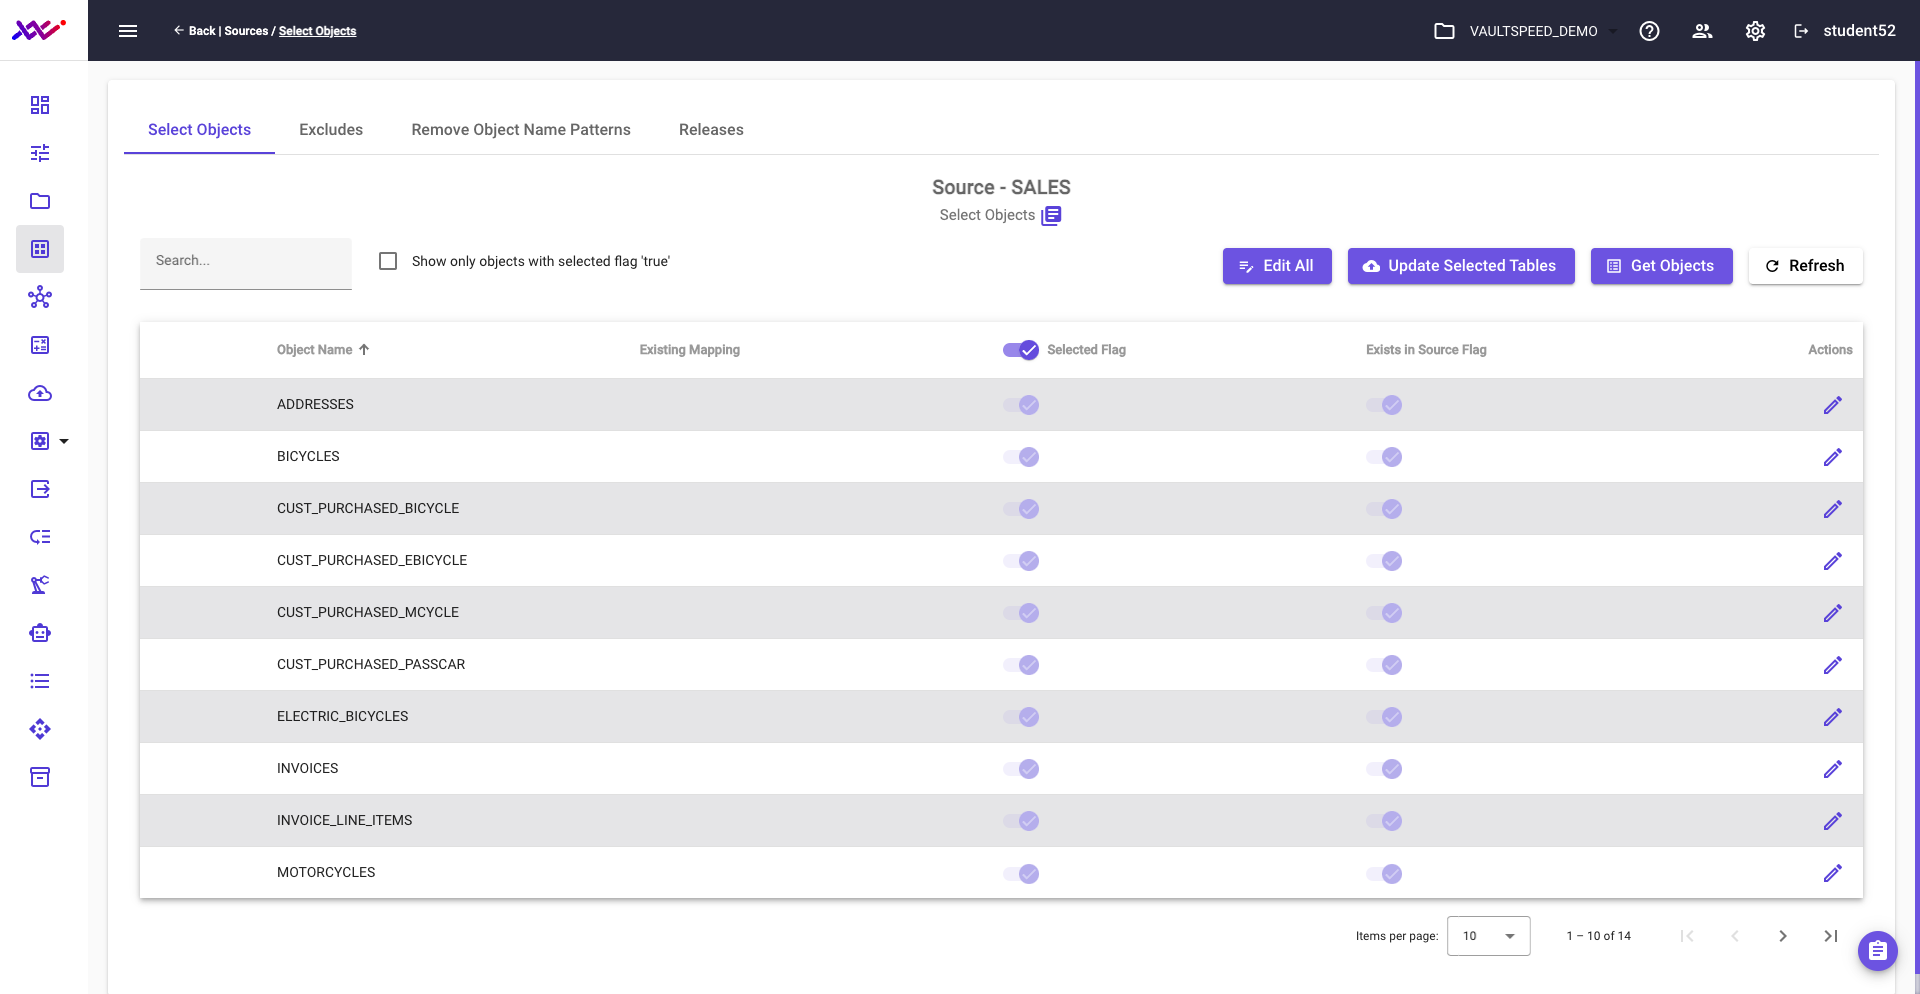
Picture 23
Picture 24 shows the selection of the source objects for Data Source src2. The harvested metadata contains the objects relating to the product inventory.
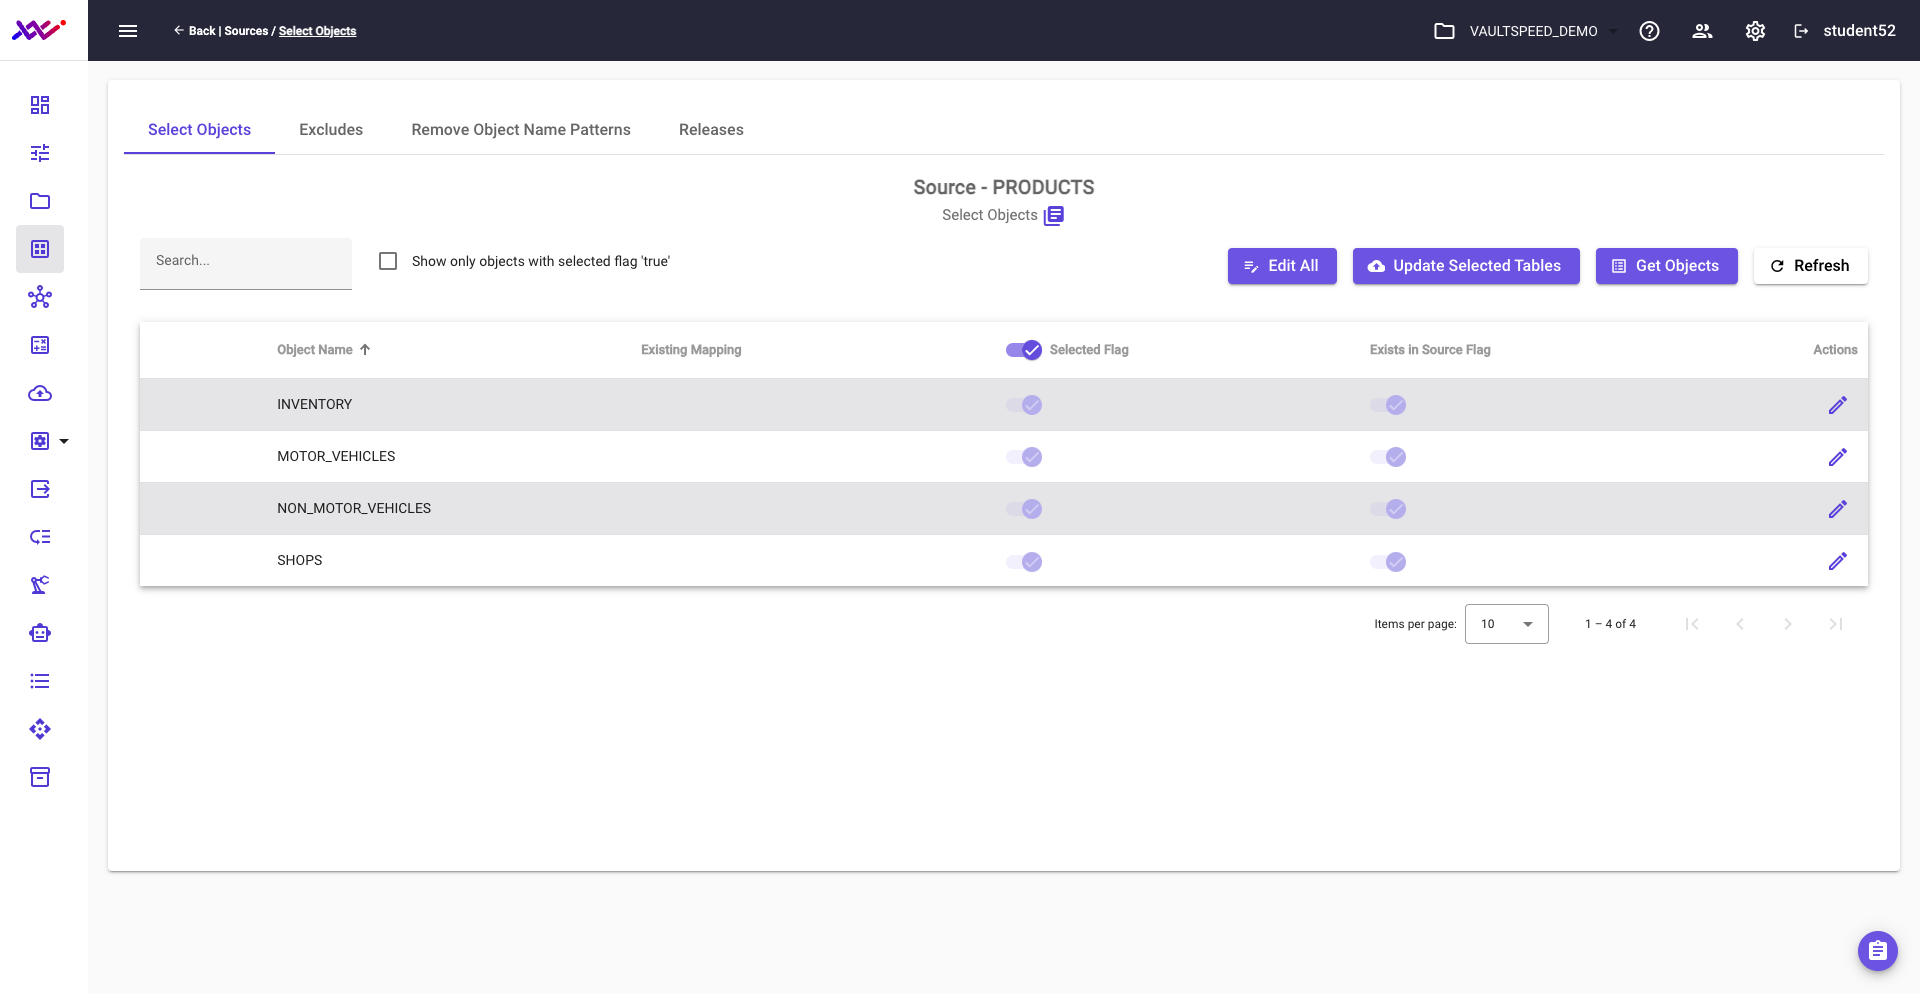
Picture 24
Picture 25 shows the selection of the source objects for Data Source src3. The harvested metadata contains the objects of the source that tracks maintenance and rental services.
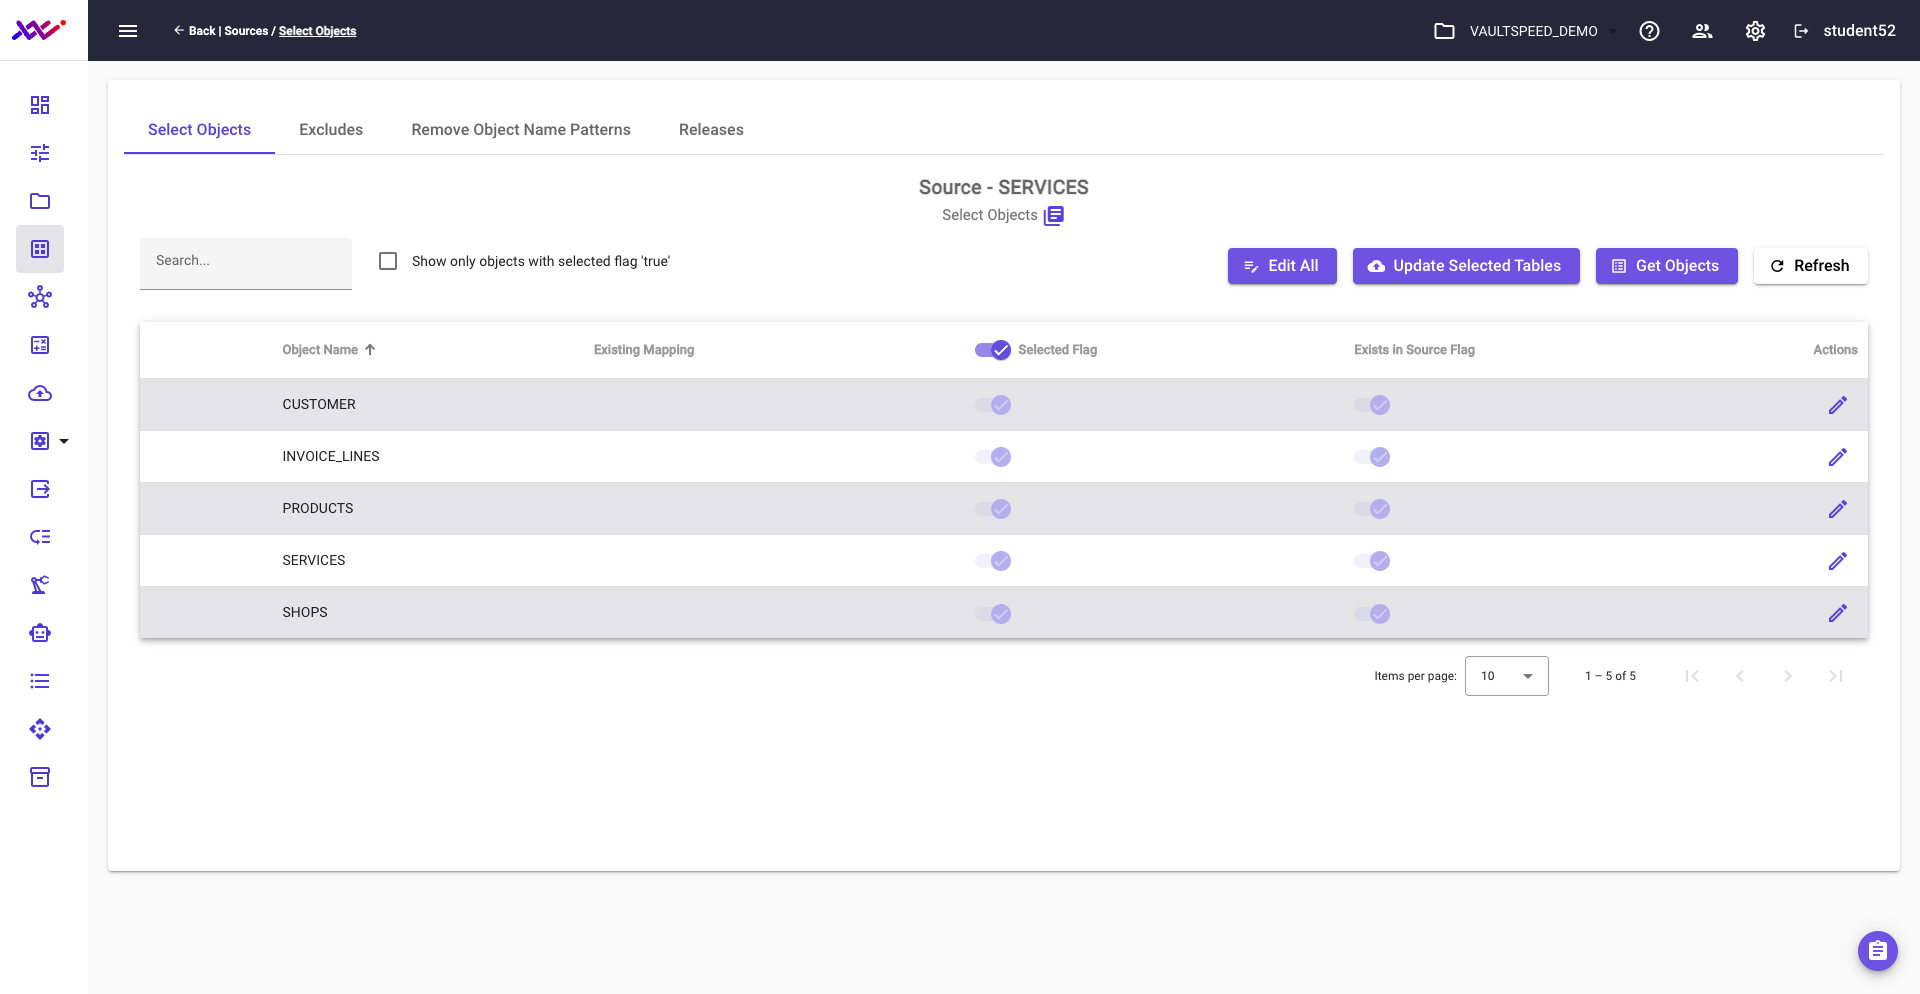
Picture 25
Step 2: define the mapping of your source model toward a Data Vault model
The next challenge VaultSpeed solves is mapping large volumes of source metadata into pre-built automation templates.
To streamline this process, VaultSpeed relies on two key components:
1. A smart rule engine within the metadata repository that analyzes harvested metadata and proposes a preliminary physical target model.
2. A graphical user interface (GUI) equipped with a powerful data modeler that lets users review, accept, correct, or enrich the proposed model—ensuring full control over the final outcome.
Together, this toolset enables teams to transform raw source metadata into a well-structured Data Vault target model, guided by the conceptual business model.
Modeling source 1
Based on the metadata captured in Step 1, VaultSpeed presents a proposed model—an initial solution to our Data Vault puzzle. This autogenerated model reflects VaultSpeed’s interpretation of the source data and serves as a starting point for refinement.
In the remainder of this section, we’ll walk through several examples to demonstrate how this modeling process unfolds in practice.
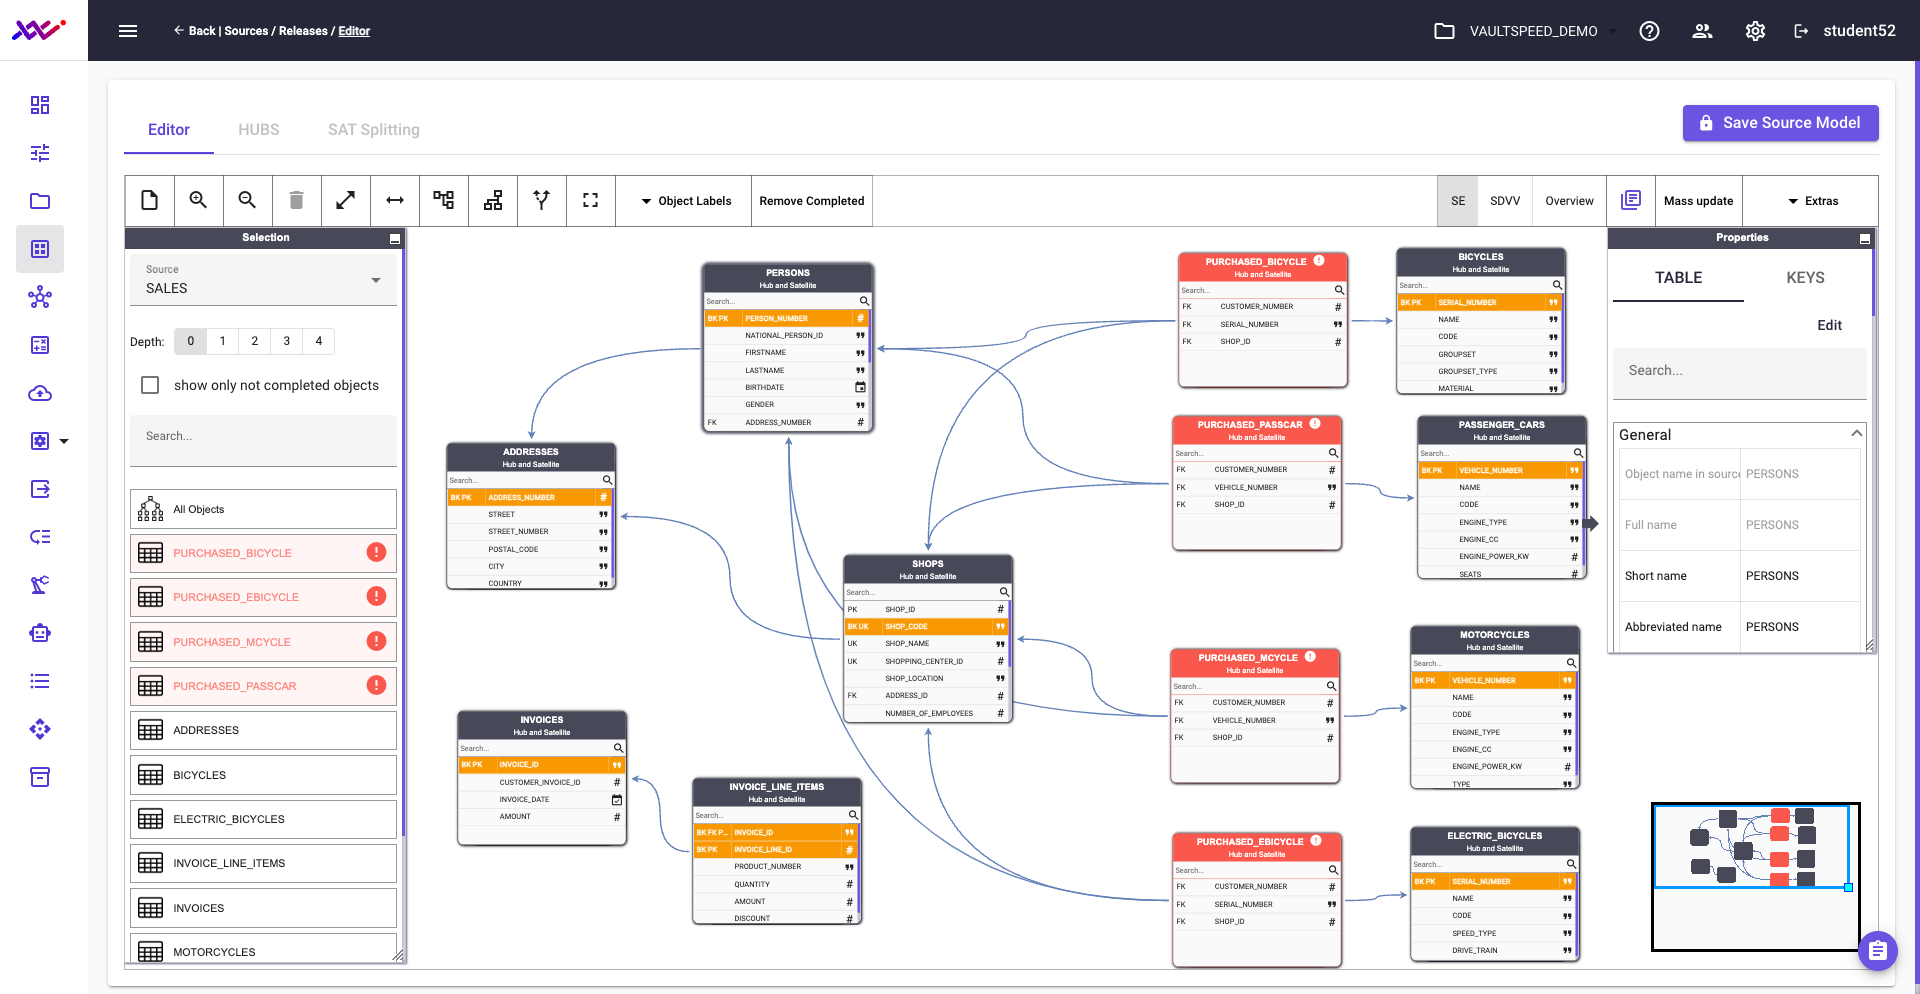
Picture 26
Accept
Within VaultSpeed’s user community, over 70% of modeling proposals are approved without modification. This high success rate reflects the platform’s ability to accurately interpret a wide range of settings—such as multi- vs. single-master configurations, default parameter values, naming conventions, object types, CDC (Change Data Capture) rules, and data quality controls.
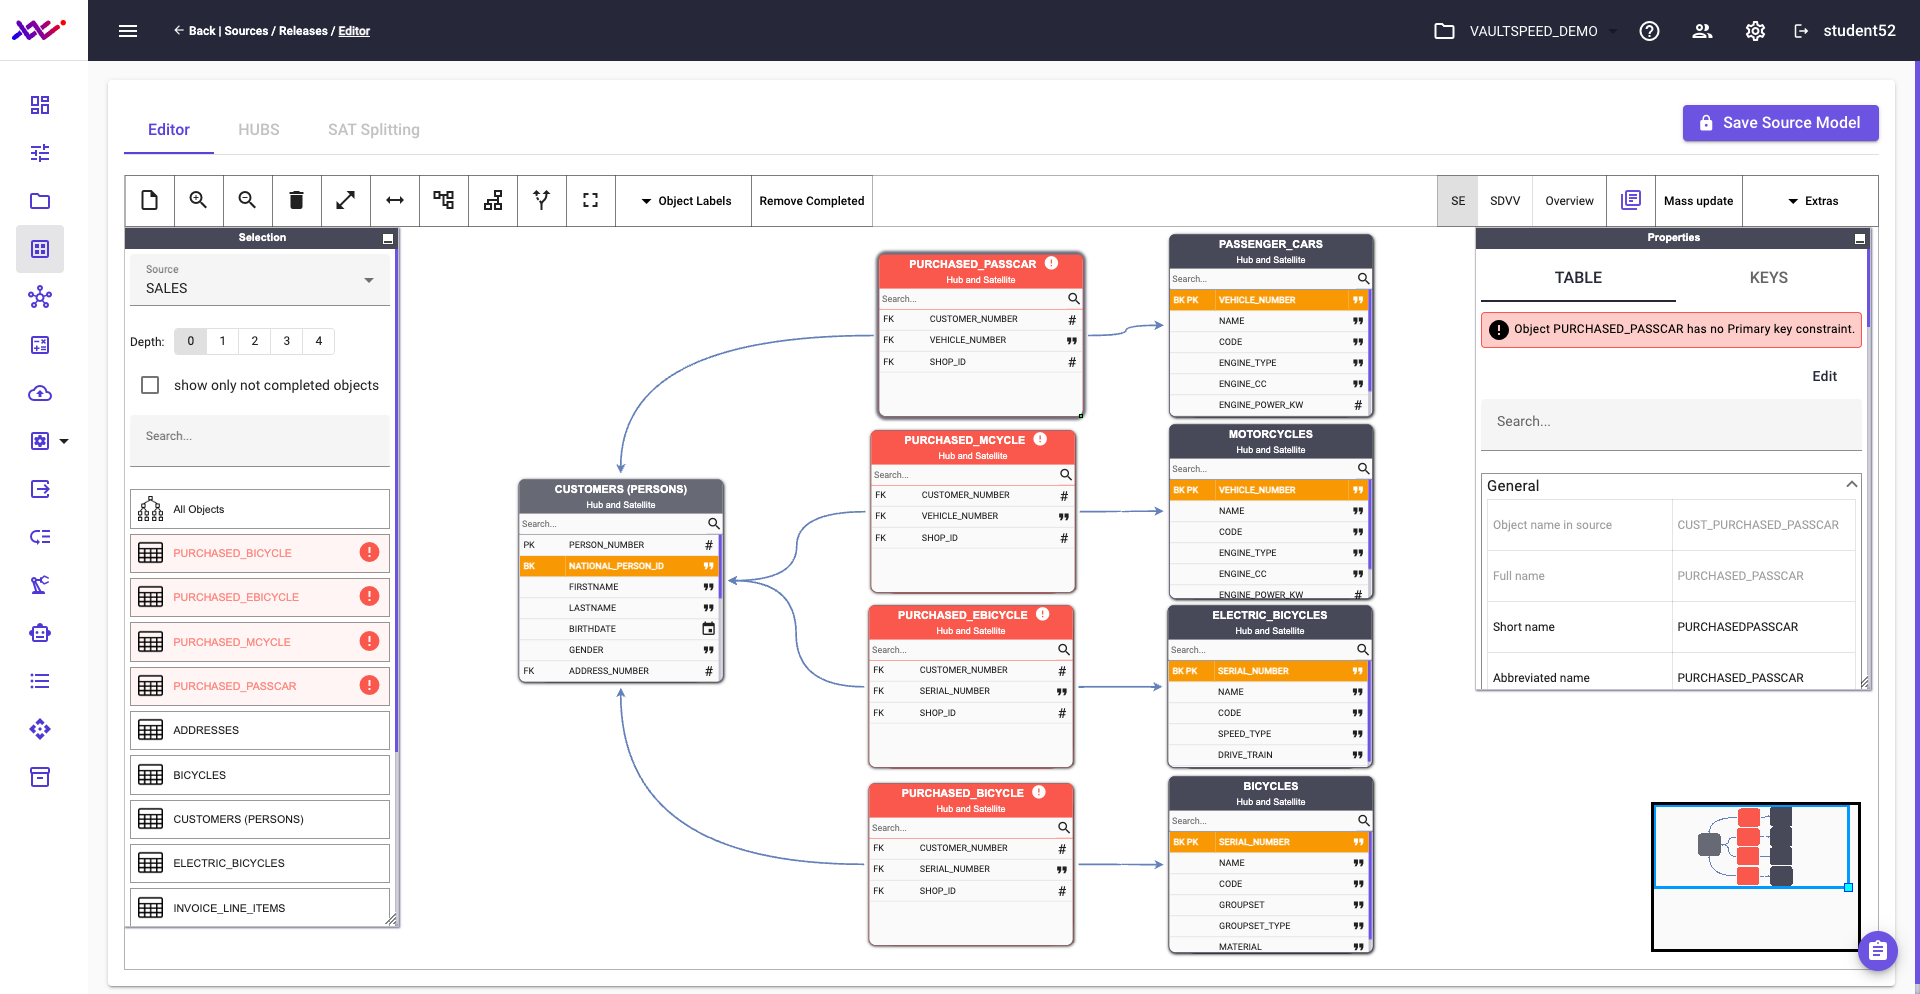
A good example of this alignment is found in how VaultSpeed handles the modeling of bicycles, passenger cars, motorcycles, and e-bikes. The platform correctly proposes each as a hub with an associated satellite, using their respective serial numbers or vehicle IDs as business keys—just as a human modeler would.
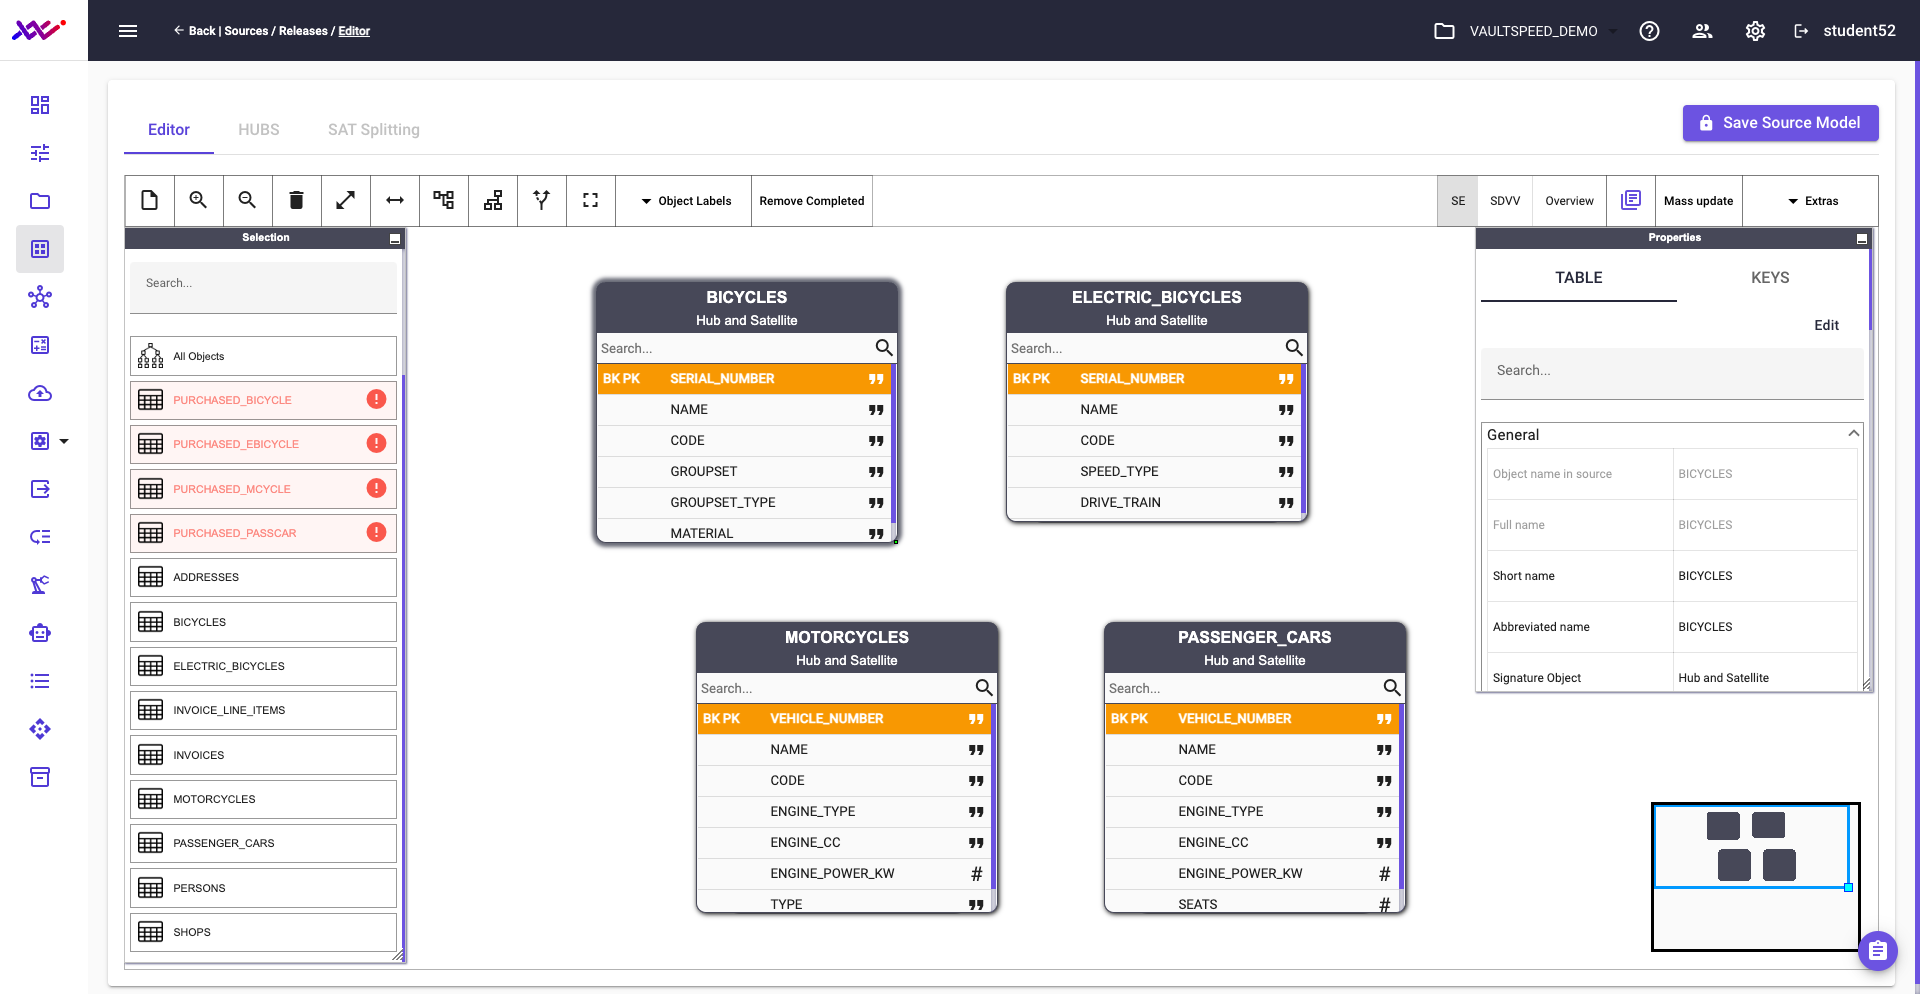
Picture 27
Correct
In our source data, the persons object exists at level 2 of the party taxonomy and includes both employees and customers. To align with the business model—which treats these as distinct entities—we need to split this object and go one level deeper in the taxonomy.
VaultSpeed makes this easy. Simply right-click the source object and select the option to create a new object split. This allows you to separate customer data from employee data and map each to its appropriate hub in the Data Vault model..
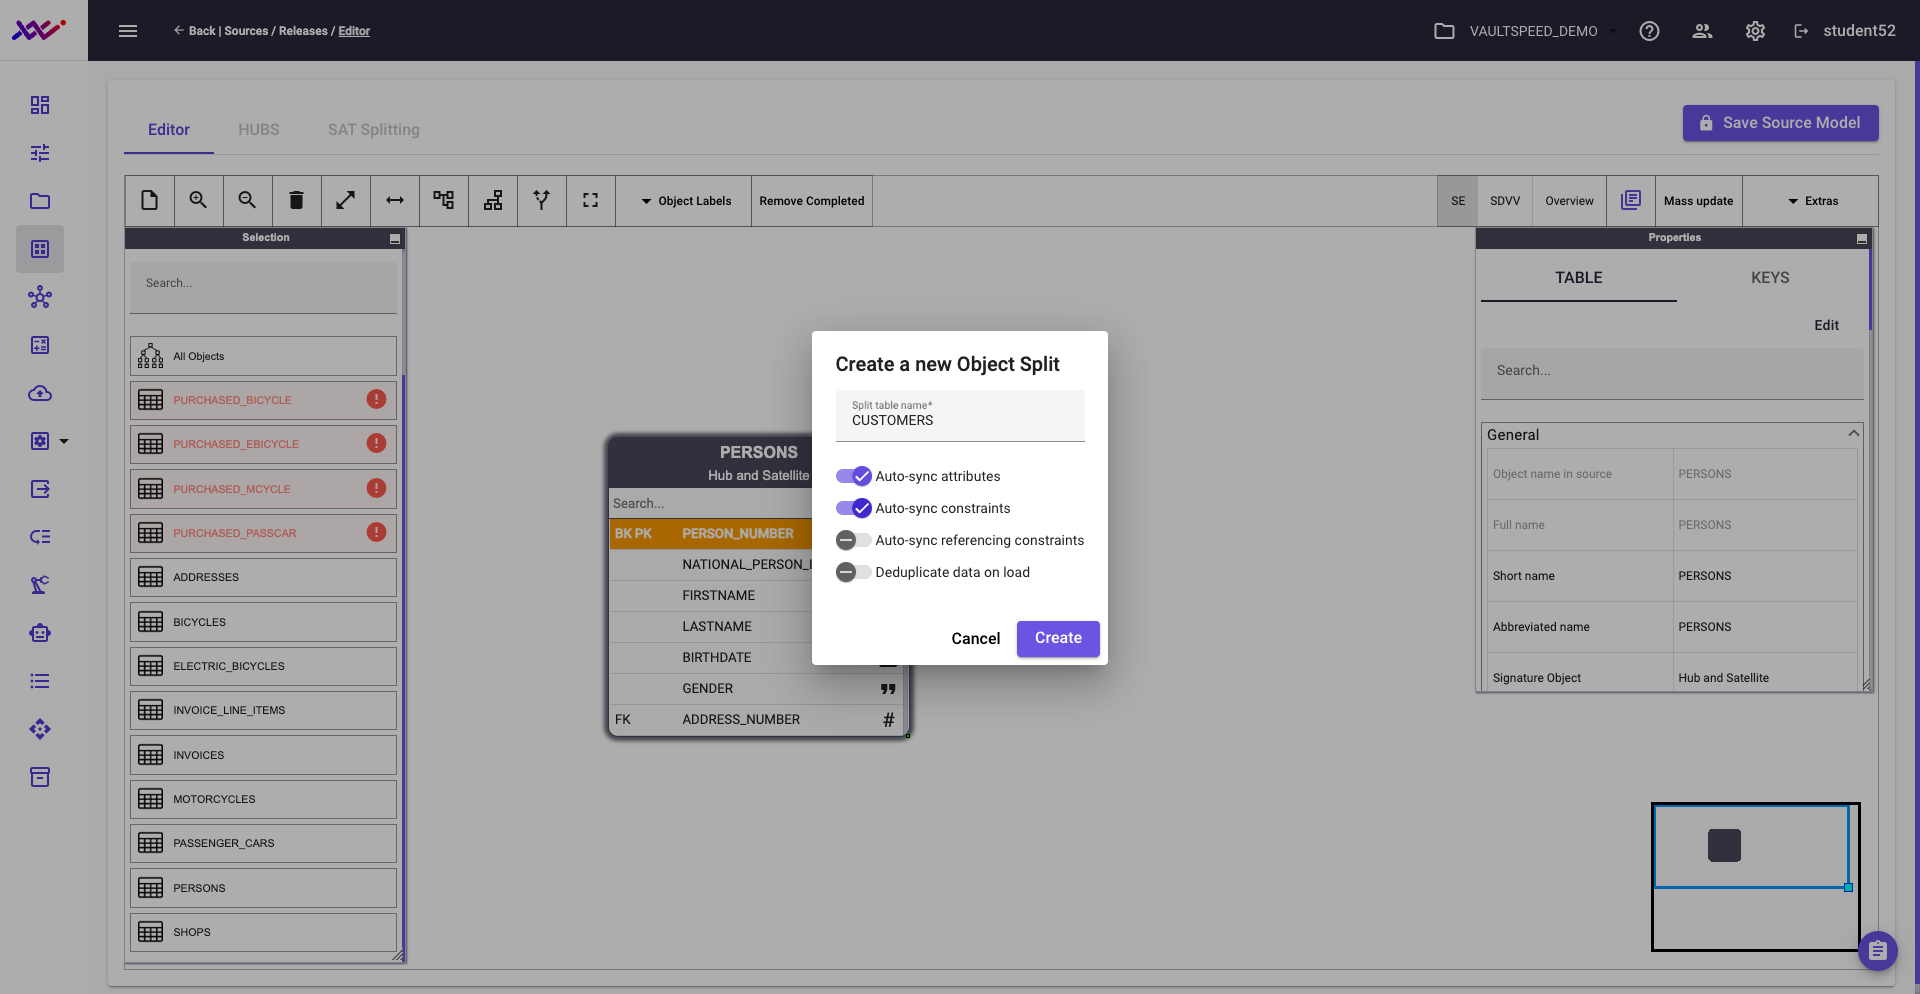
Picture 28
Upon completion, the updated version of the model appears as follows:
Picture 29
Picture 30
Picture 31
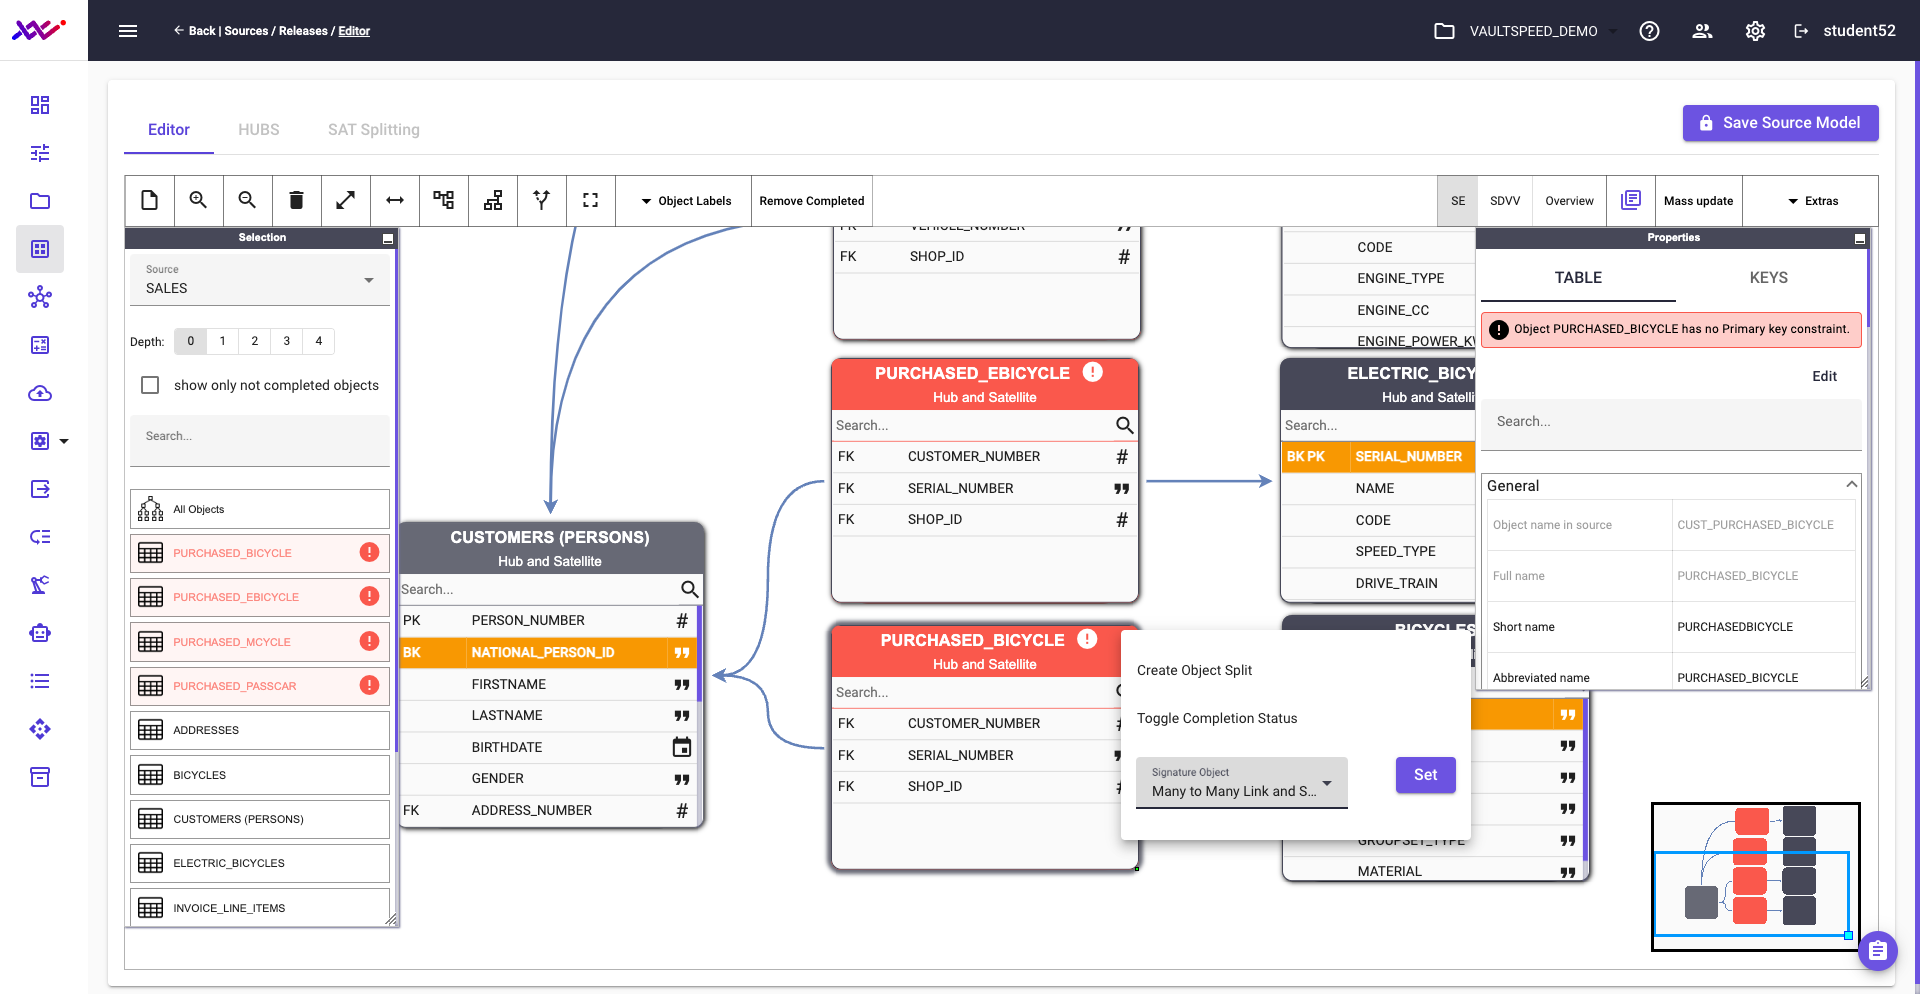
After defining all relevant purchased relationship objects as many-to-many links, the updated structure—shown in Picture 32—is now ready for integration into the target Data Vault model.
However, there's one final adjustment to make: this section must still be aligned with the taxonomy level defined for the product hub. We’ll address that in one of the upcoming steps.
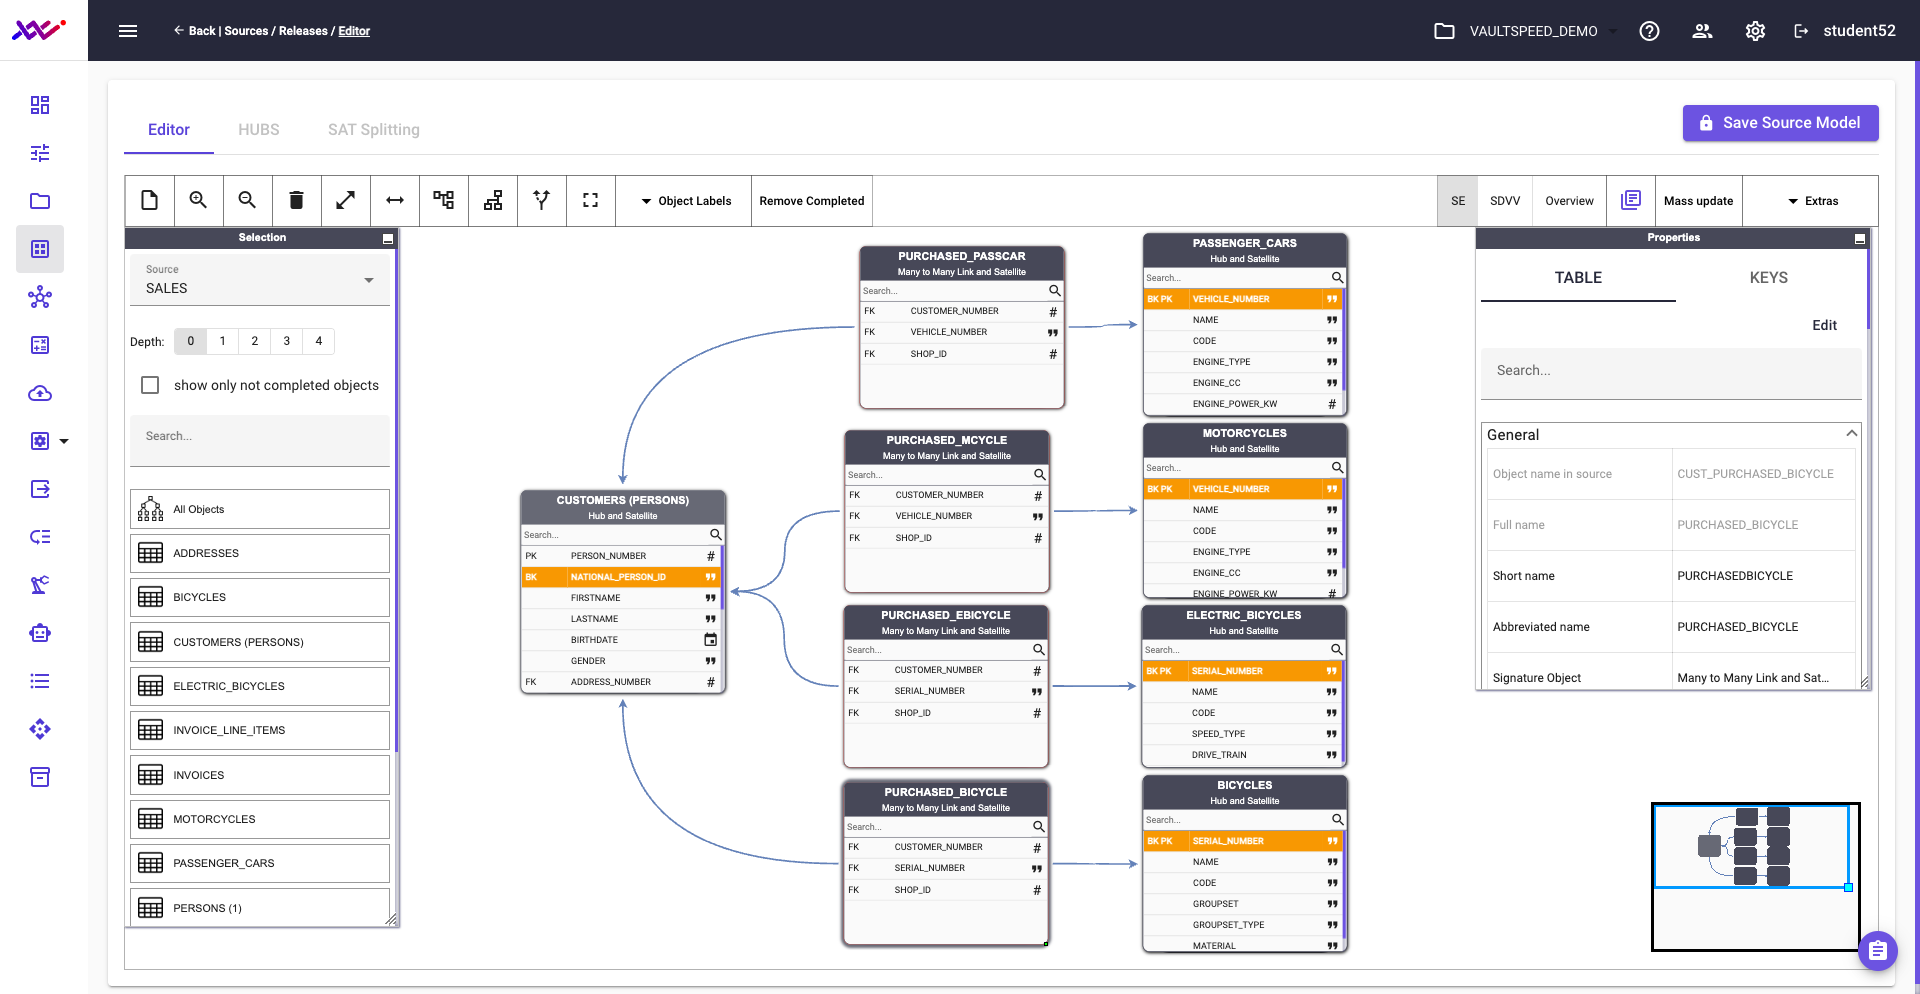
Picture 32
Modeling source 2
In the second source—the ERP-like system containing inventory data—we apply the same modeling approach. One of the key demonstrations of VaultSpeed’s flexibility is its ability to customize proposal generation settings at the source level.
For instance, the USE_SOURCE_UK_AS_BK parameter allows VaultSpeed to automatically treat unique keys as business keys. This default behavior reduces the need for manual adjustments, streamlining the process of refining the source model.
Picture 33
Modeling source 3
Finally, we apply the same modeling approach to src3, which contains the SERVICE source data. This results in the following configured source setup:
Picture 34
Step 3: Data Vault creation
The following step is to create a Data Vault.
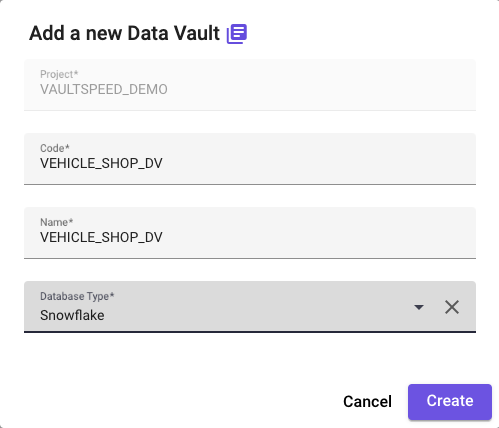
Picture 35
Create a new Data Vault release, and select all relevant sources and source releases:
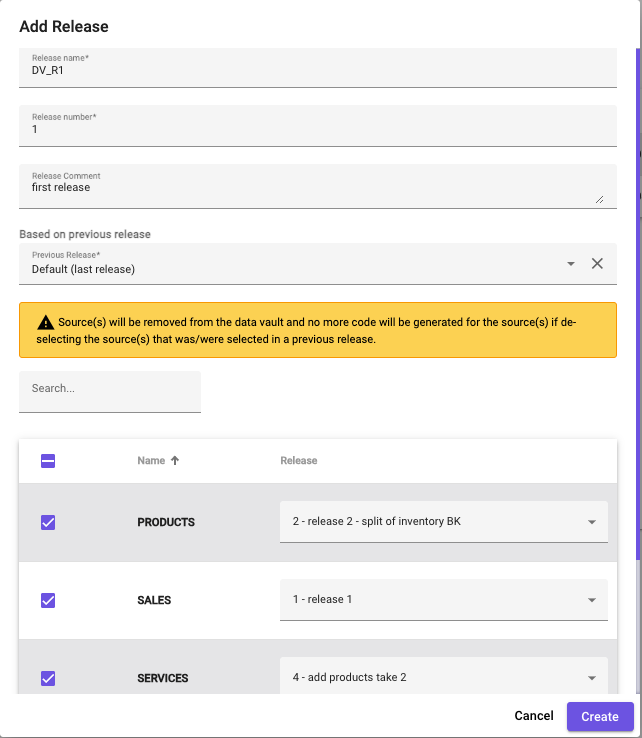
Picture 36
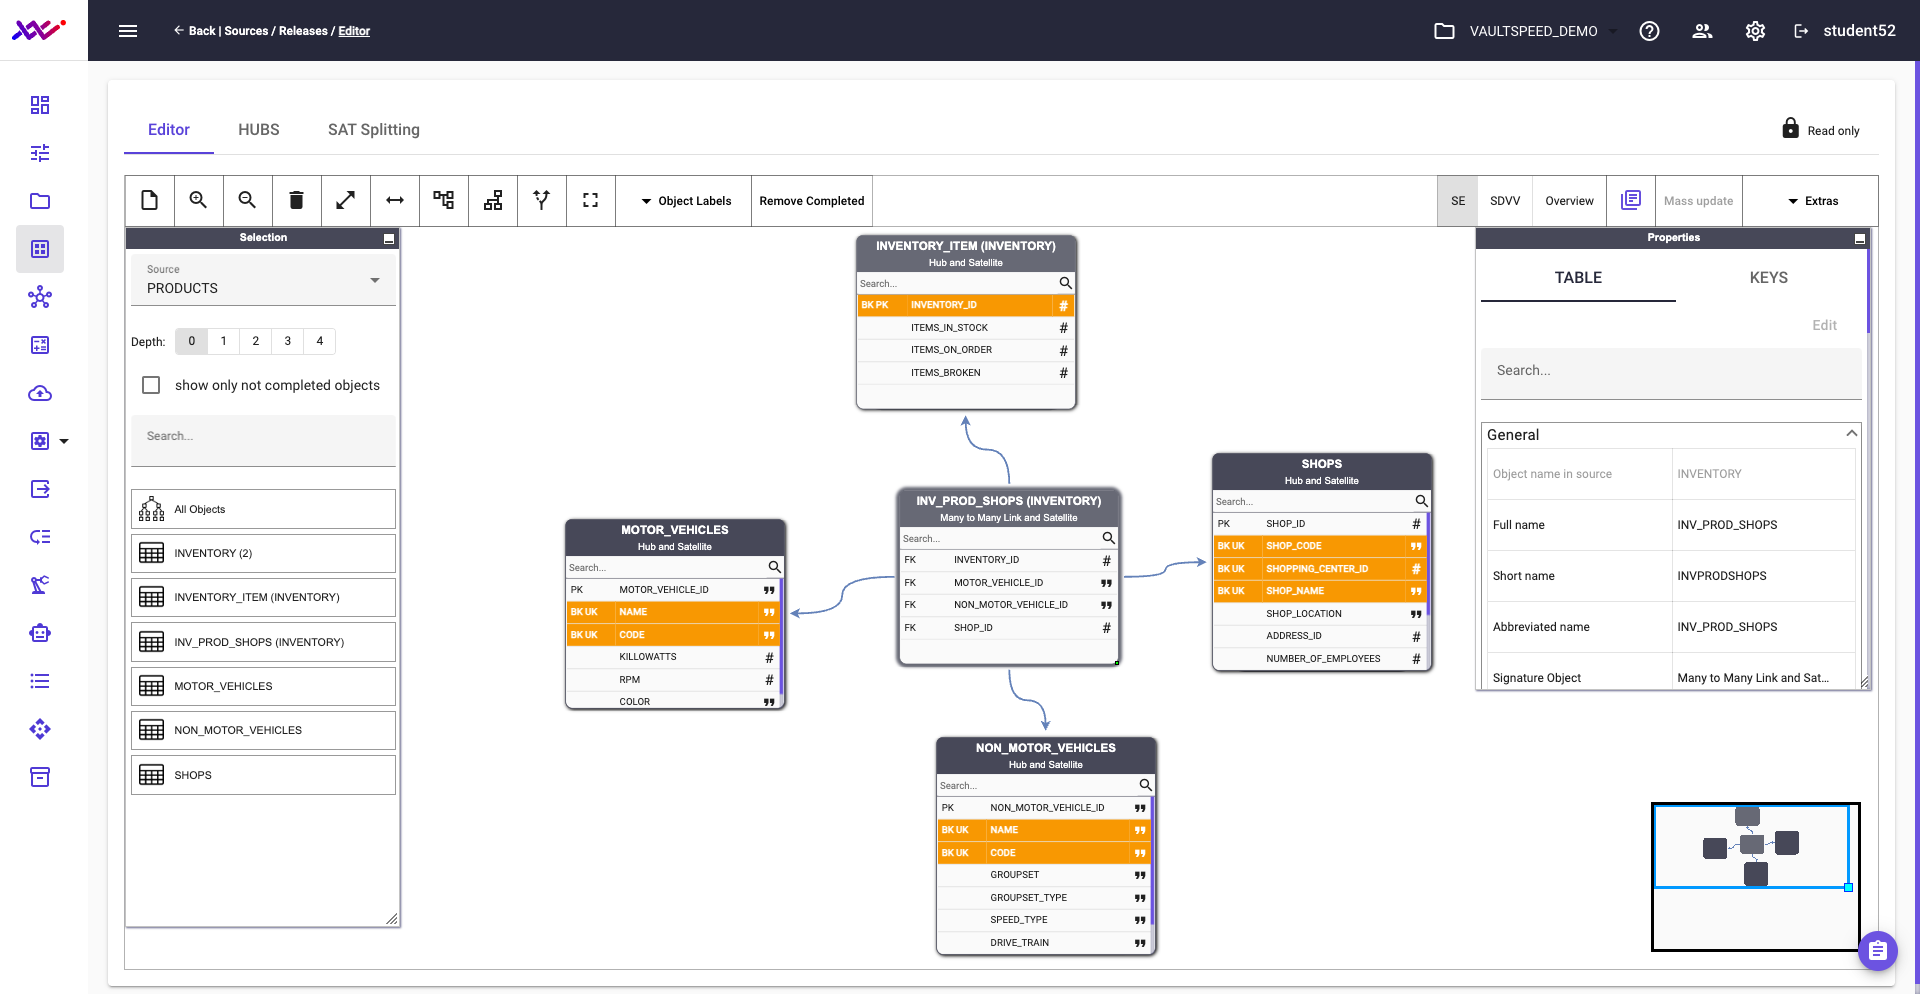
Picture 37
Picture 38
Picture 39
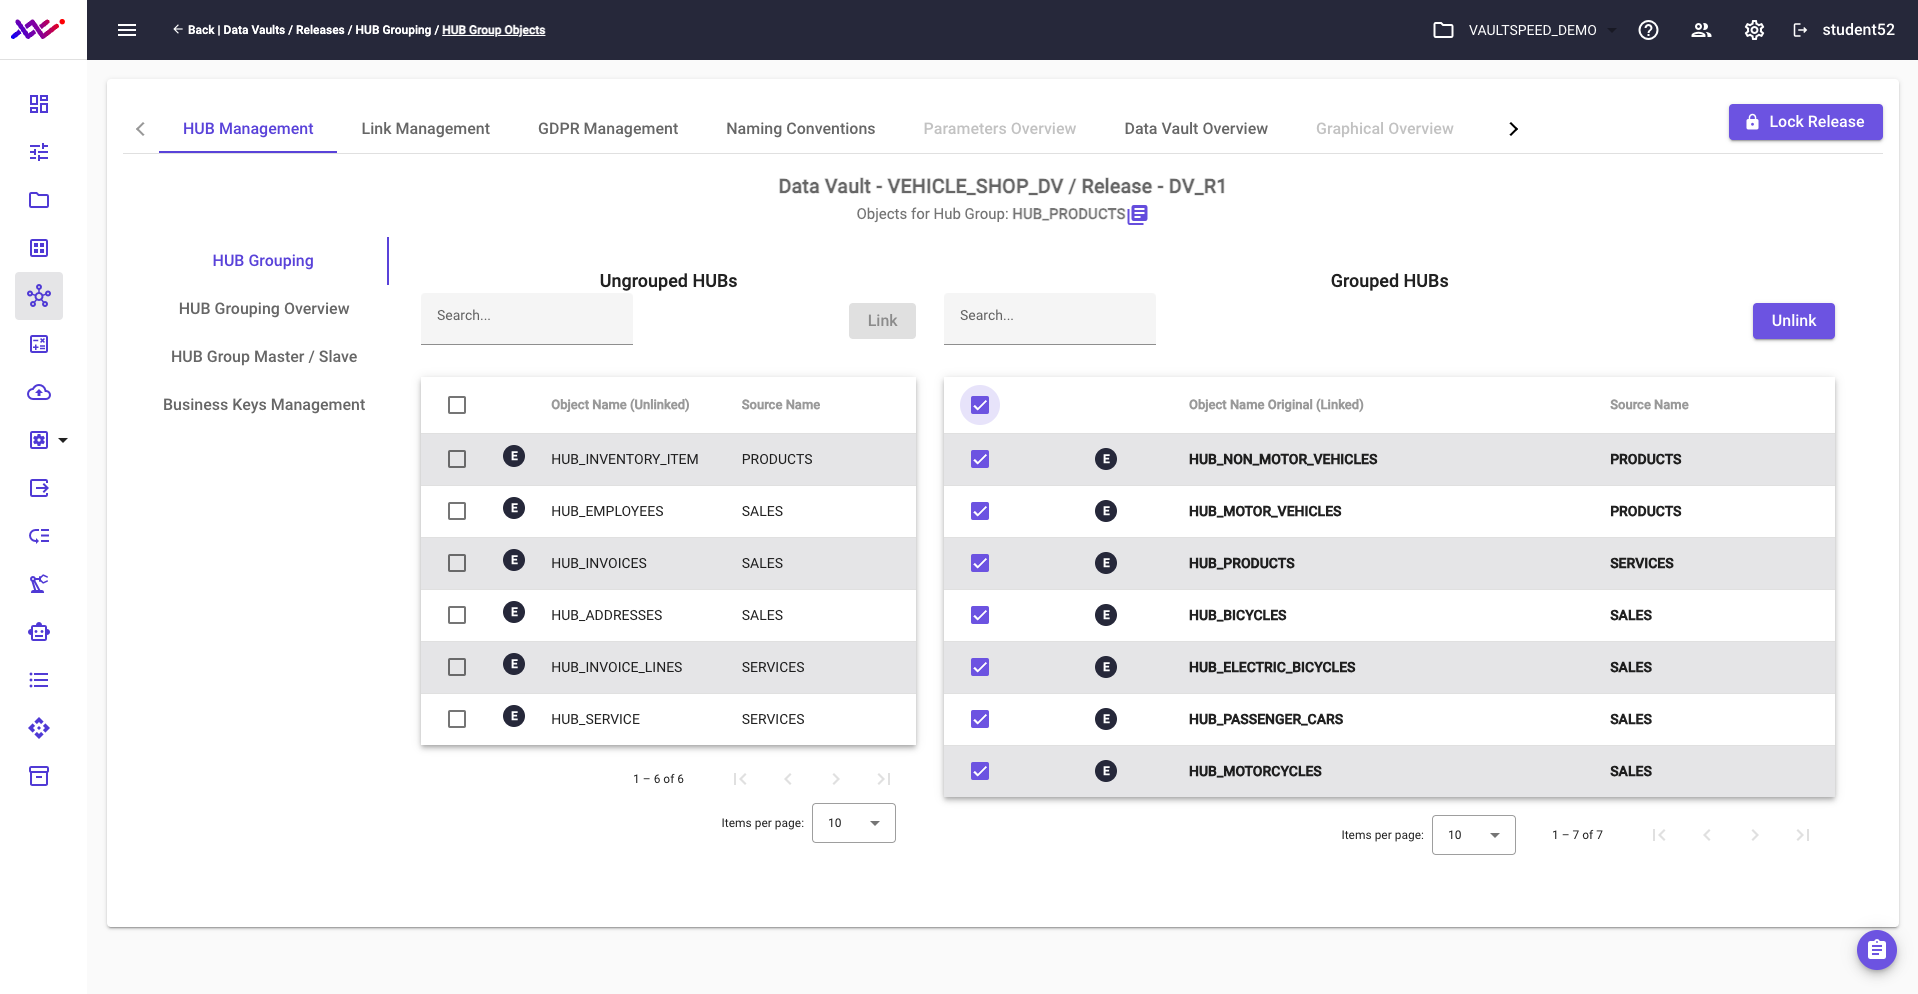
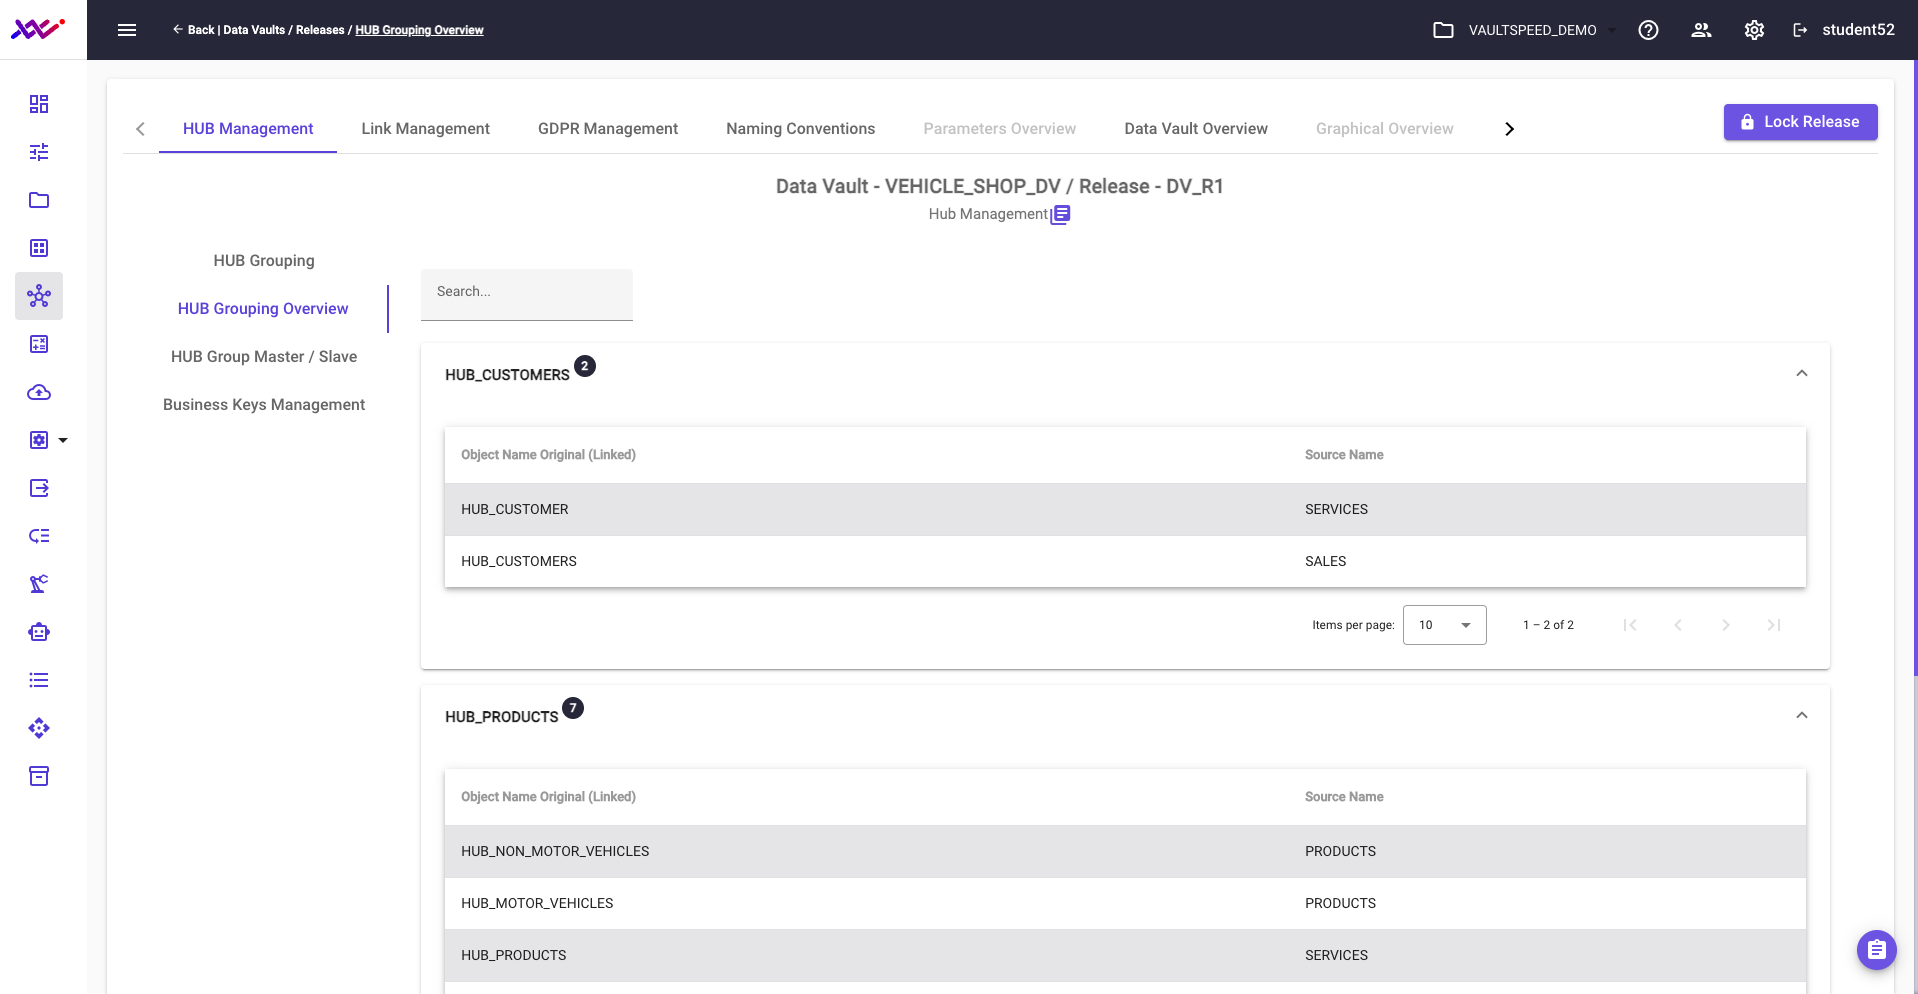
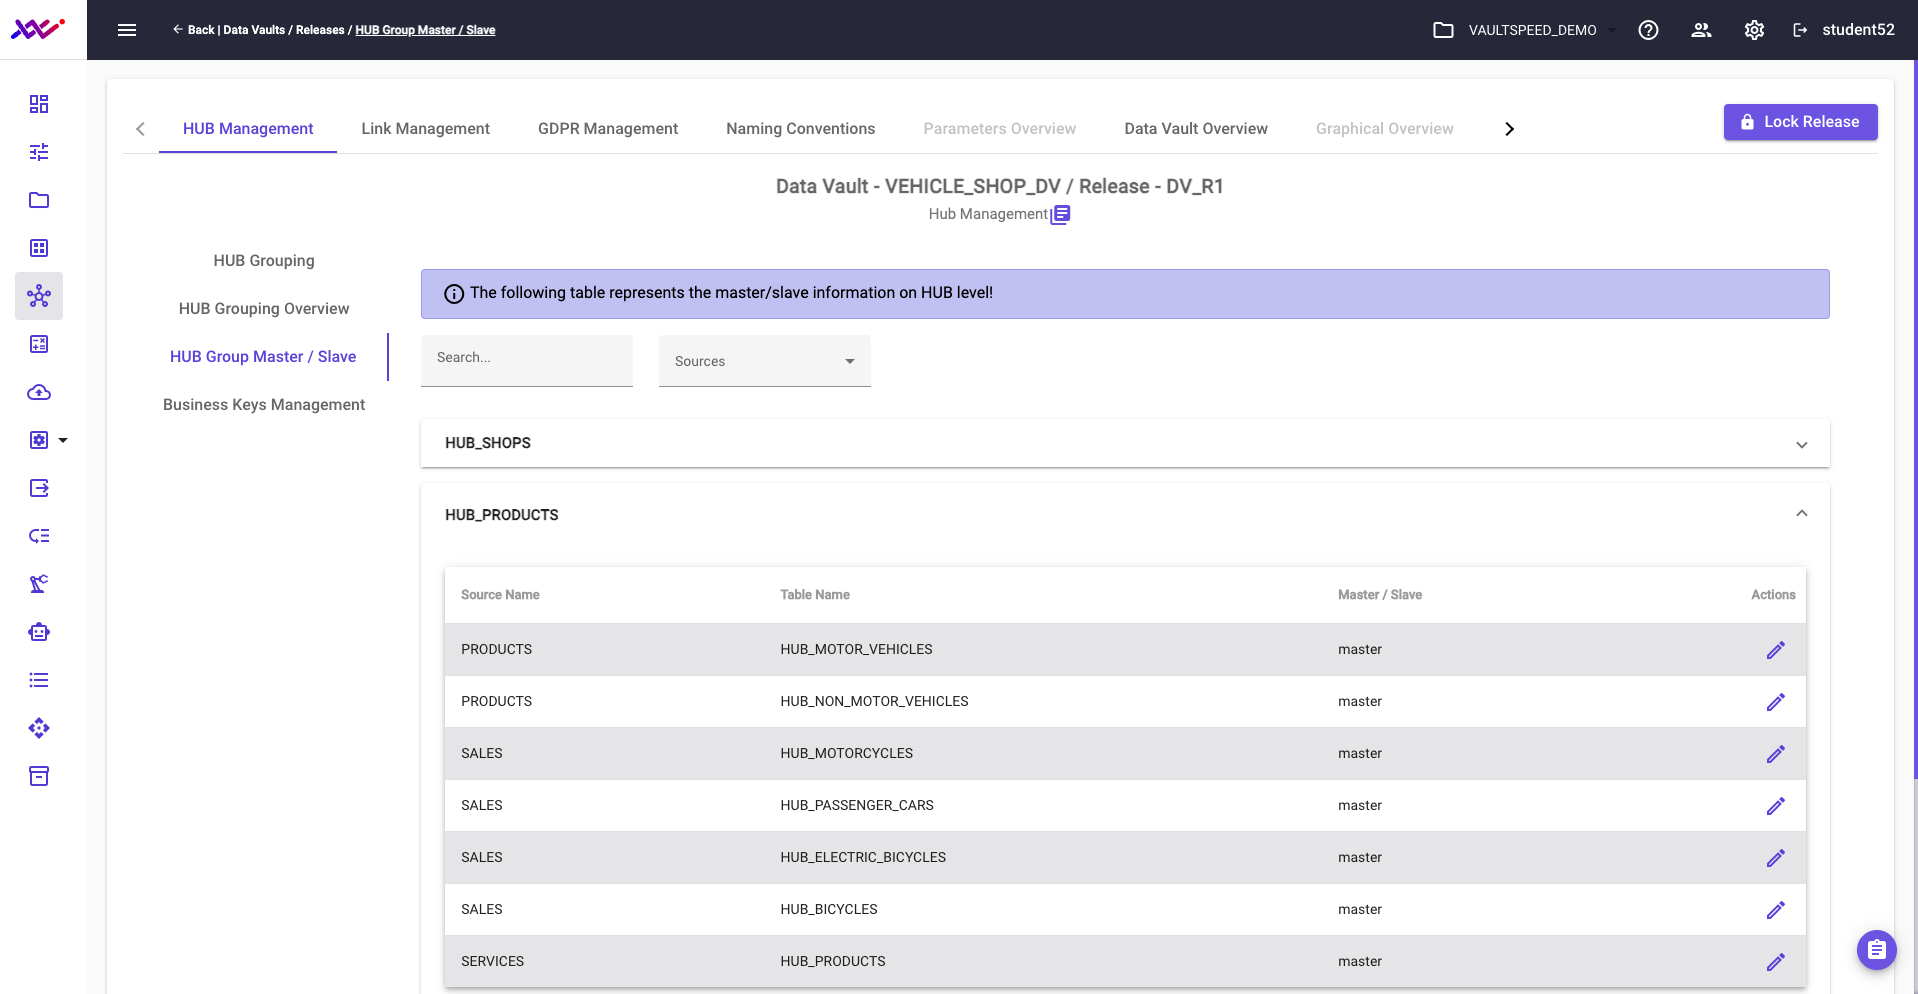
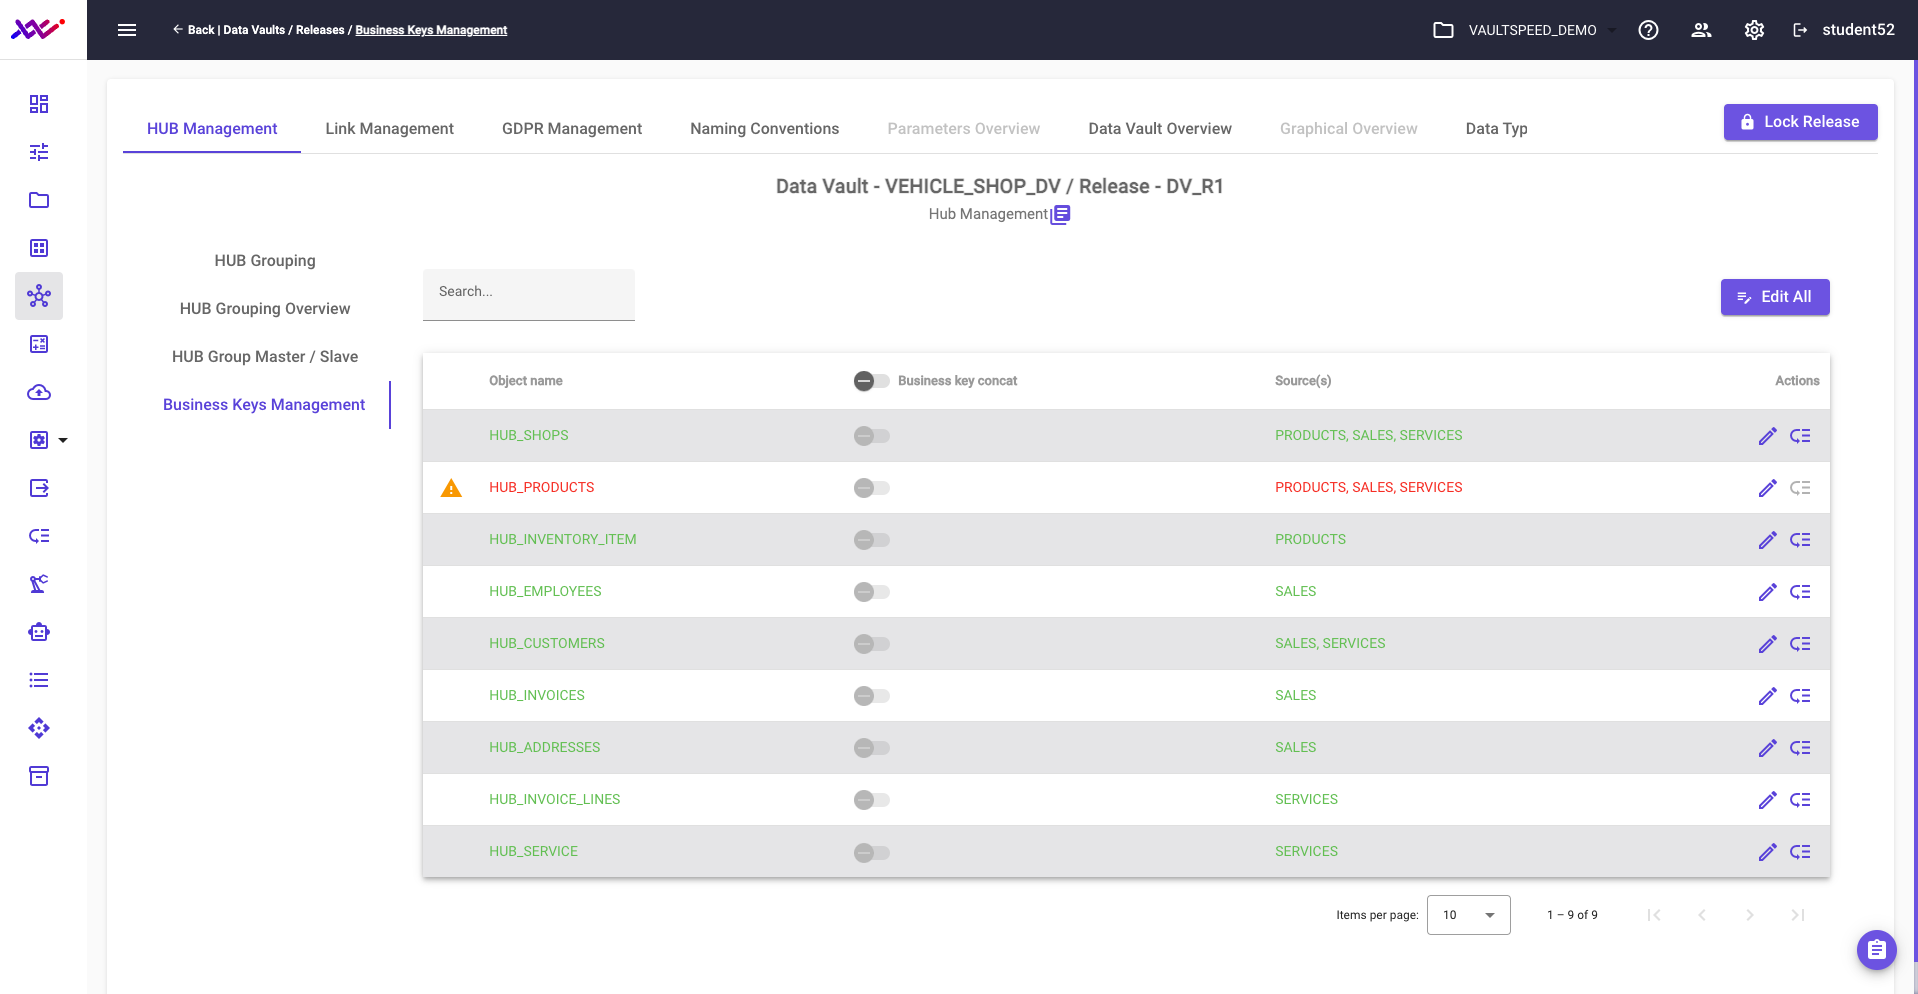
To streamline the Hub Business Key for the Product Business Element, we should create a concatenated key. This approach consolidates multiple key attributes into a single value, simplifying the hub structure—especially in multi-master scenarios where different source systems use different key names.
By concatenating the key components, we can generate a unified hash key that ensures consistency across diverse inputs. VaultSpeed intelligently flags where such concatenation may be needed, guiding you to apply it where appropriate and further strengthening the integrity of your target Data Vault model.
Picture 40
Let’s take a moment to review naming conventions within VaultSpeed Data Vault models. By default, objects are assigned system-generated names, but these can be easily modified—either individually or through global parameter settings.
In our example, to better align with the business context and target model, we’ve renamed the link to “purchased_products”, providing clearer semantic meaning for end users and stakeholders.
Picture 41
With all components now defined, we can present the complete Data Vault target model, as shown in Pictures 42 to 44. Picture 42 illustrates the integrated model for products from src1 and src2, along with the link connecting customers to purchased products, capturing the core relationship that drives the business use case.
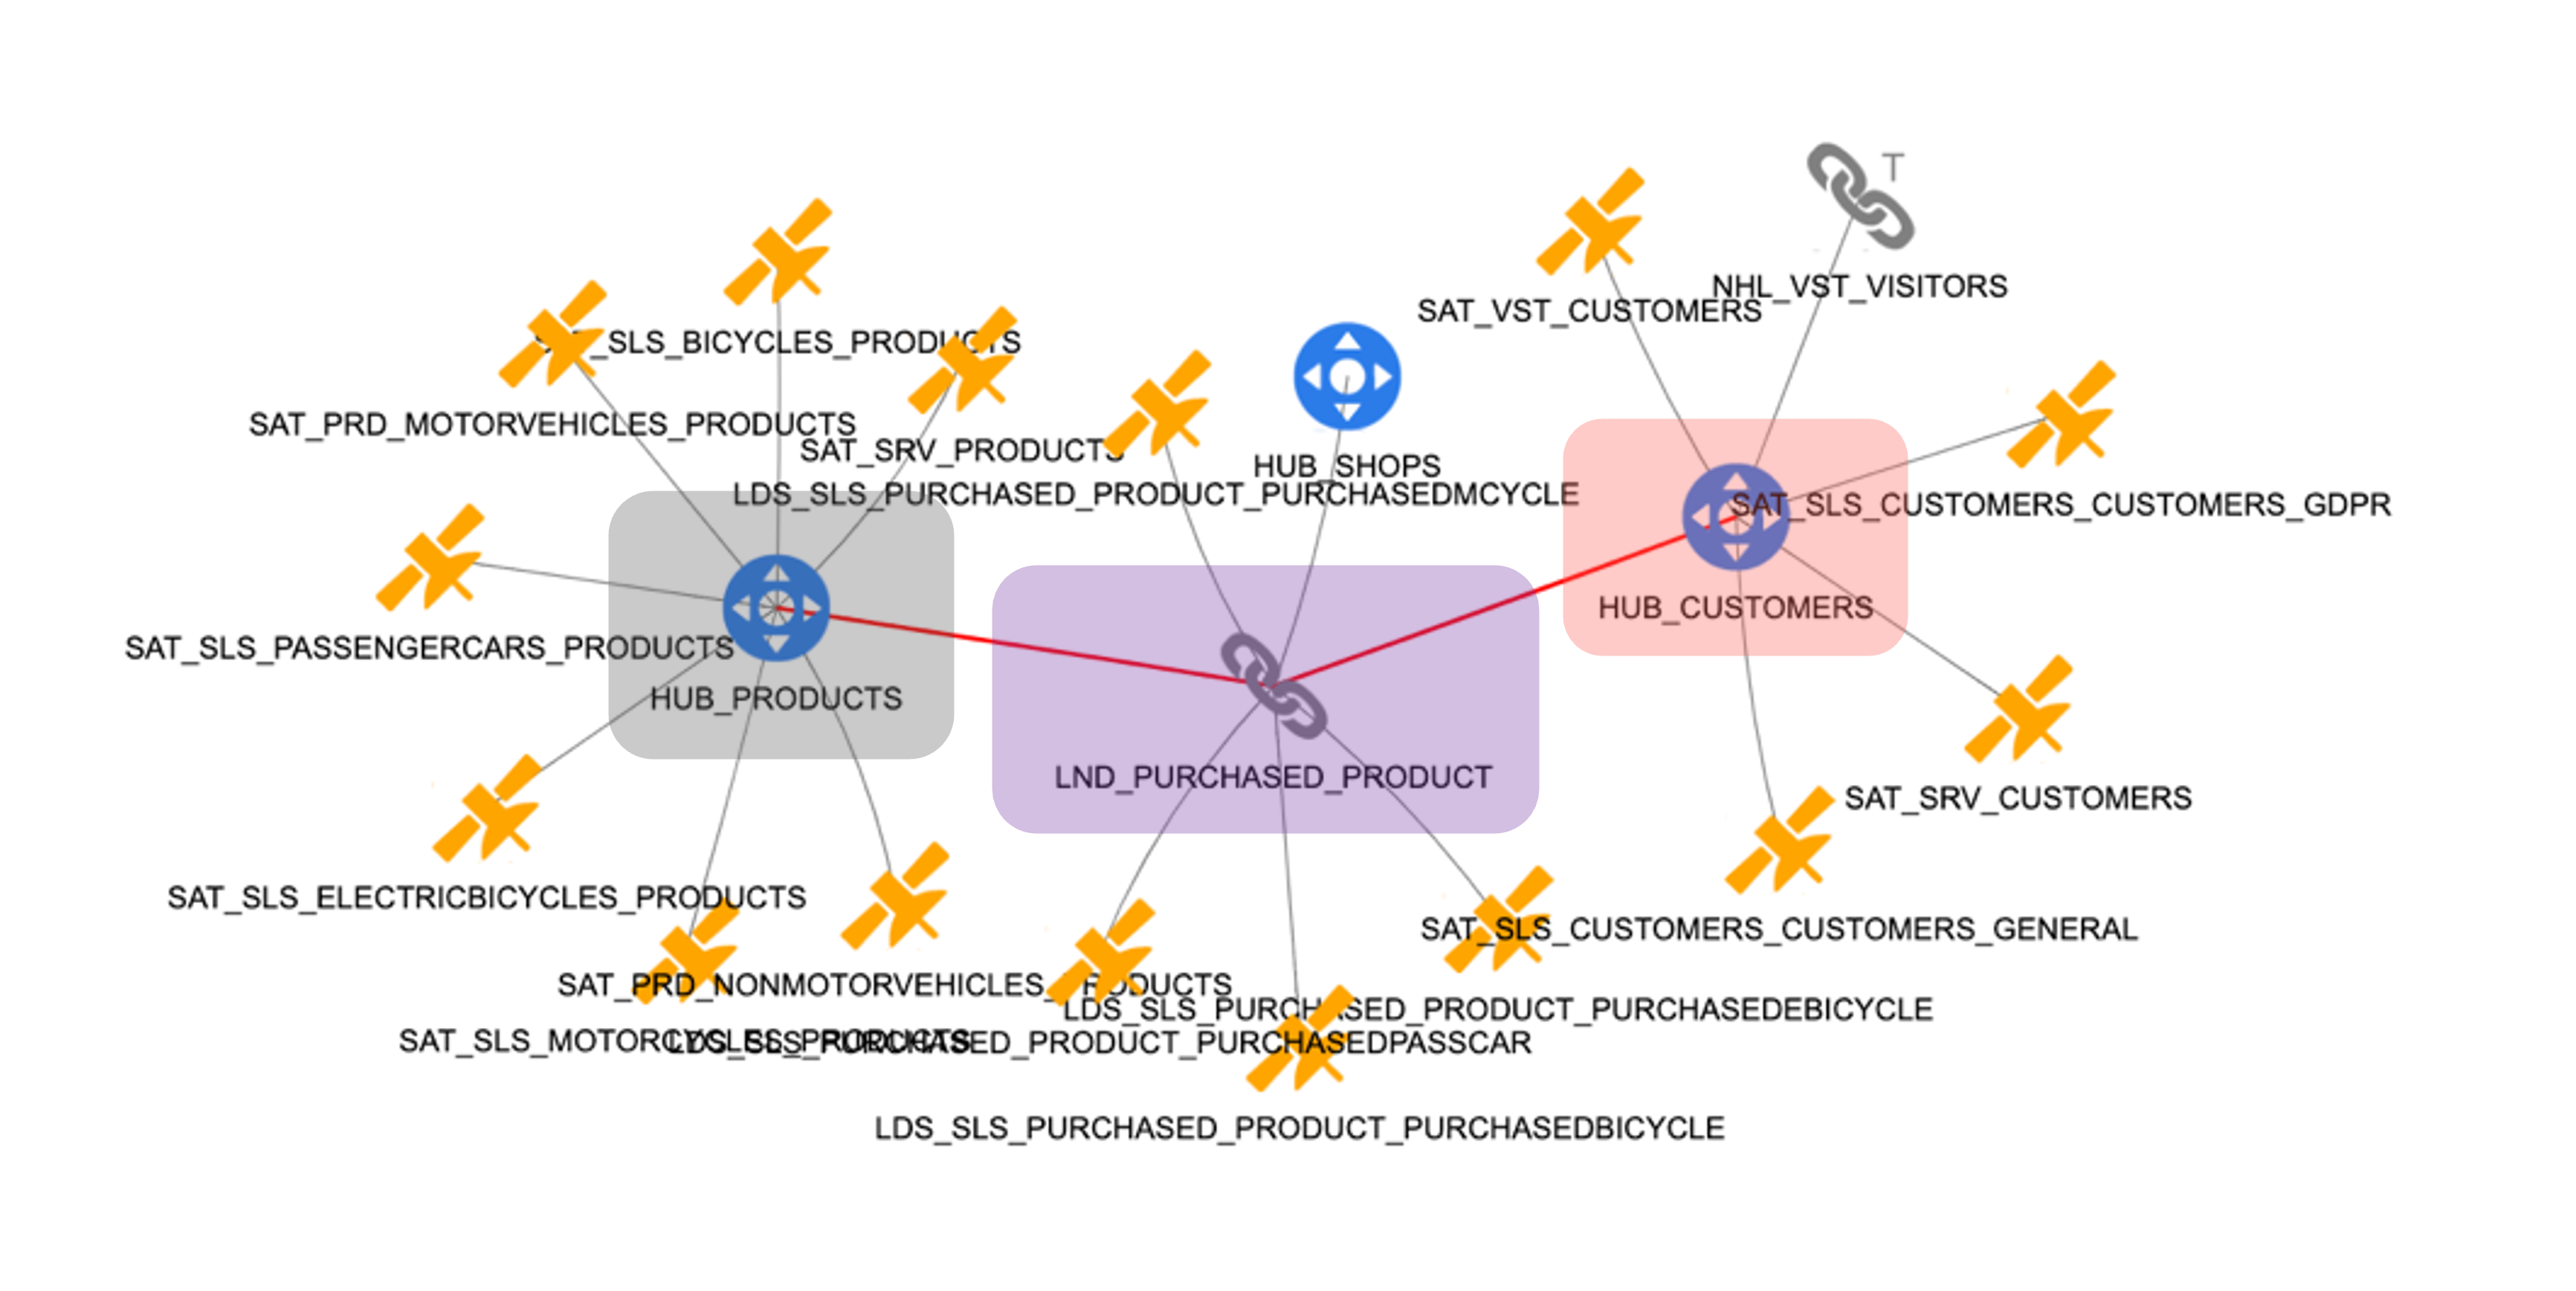
Picture 42
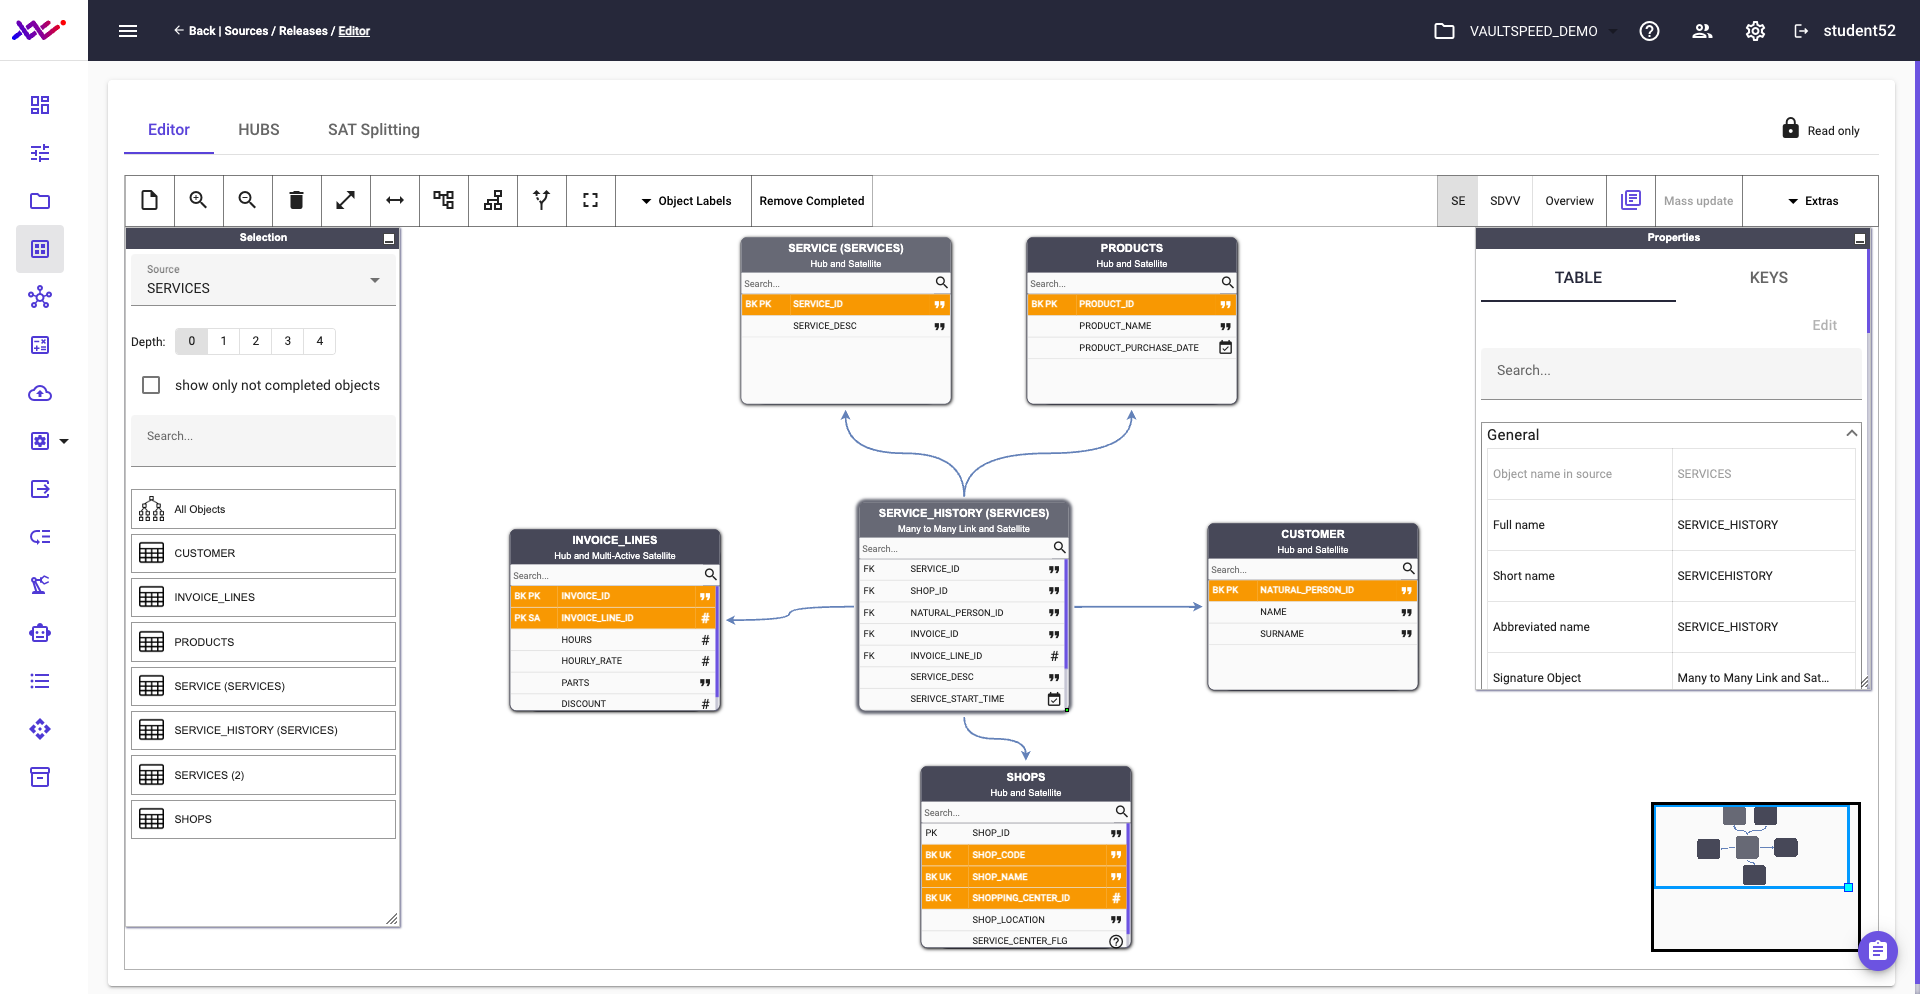
The diagram in picture 43 shows the detailed model of the service hub from src3:
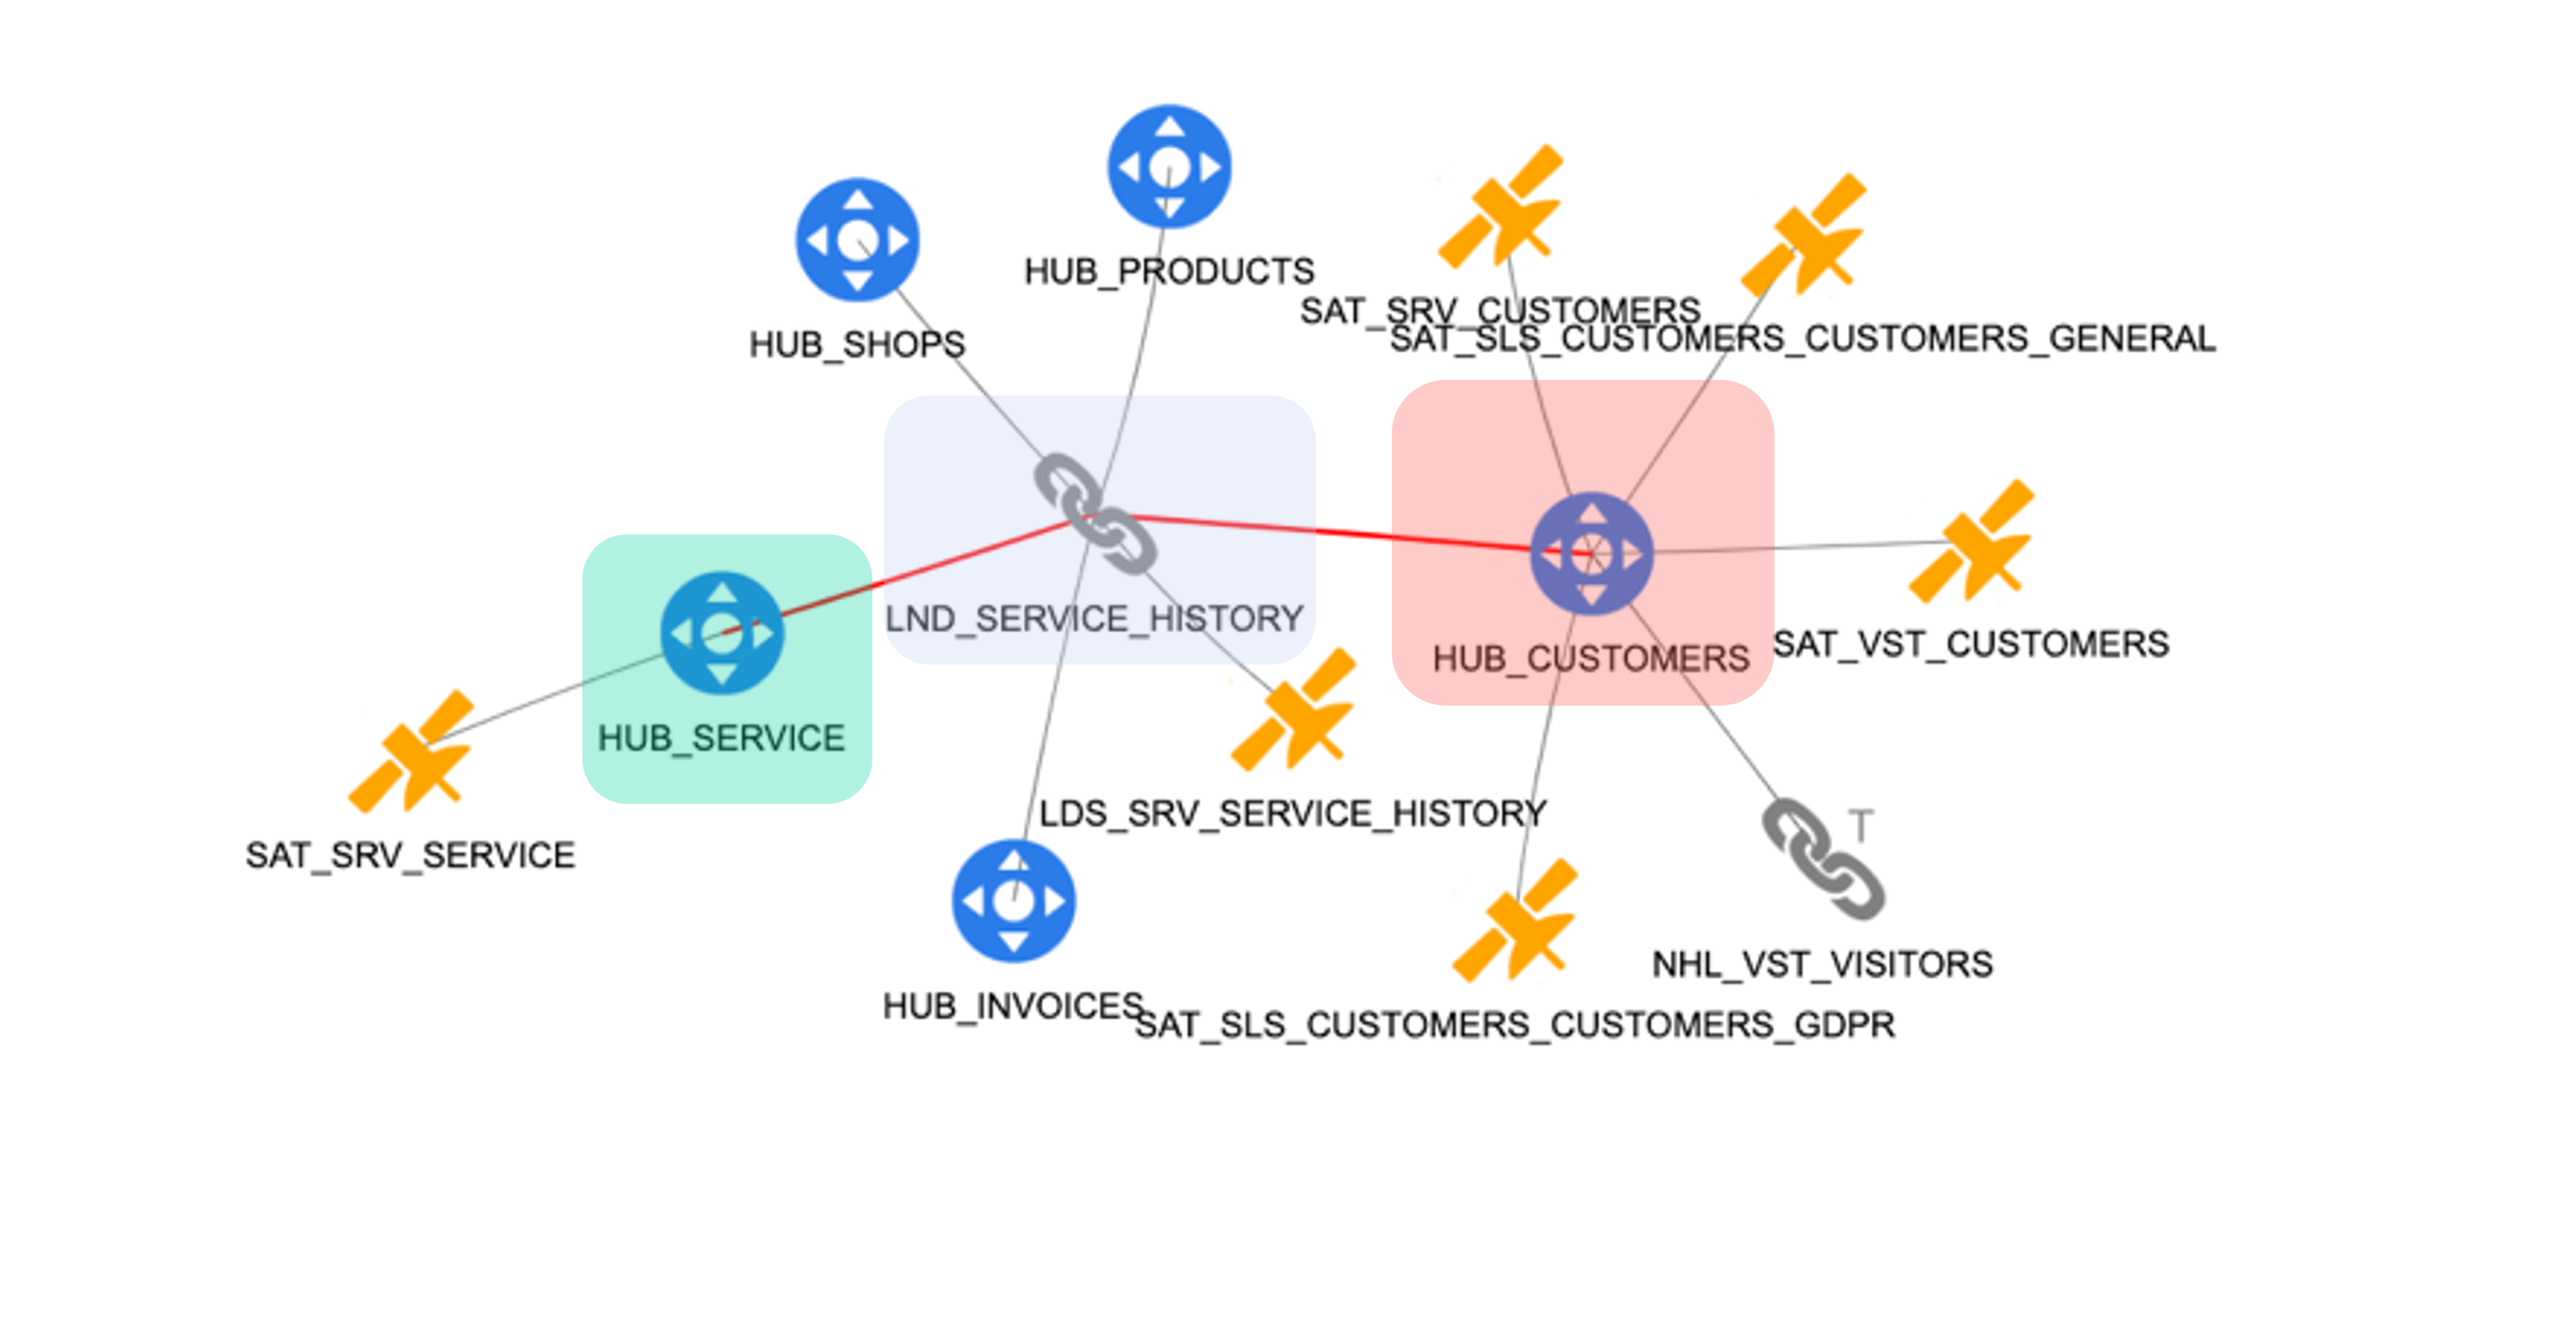
Picture 43
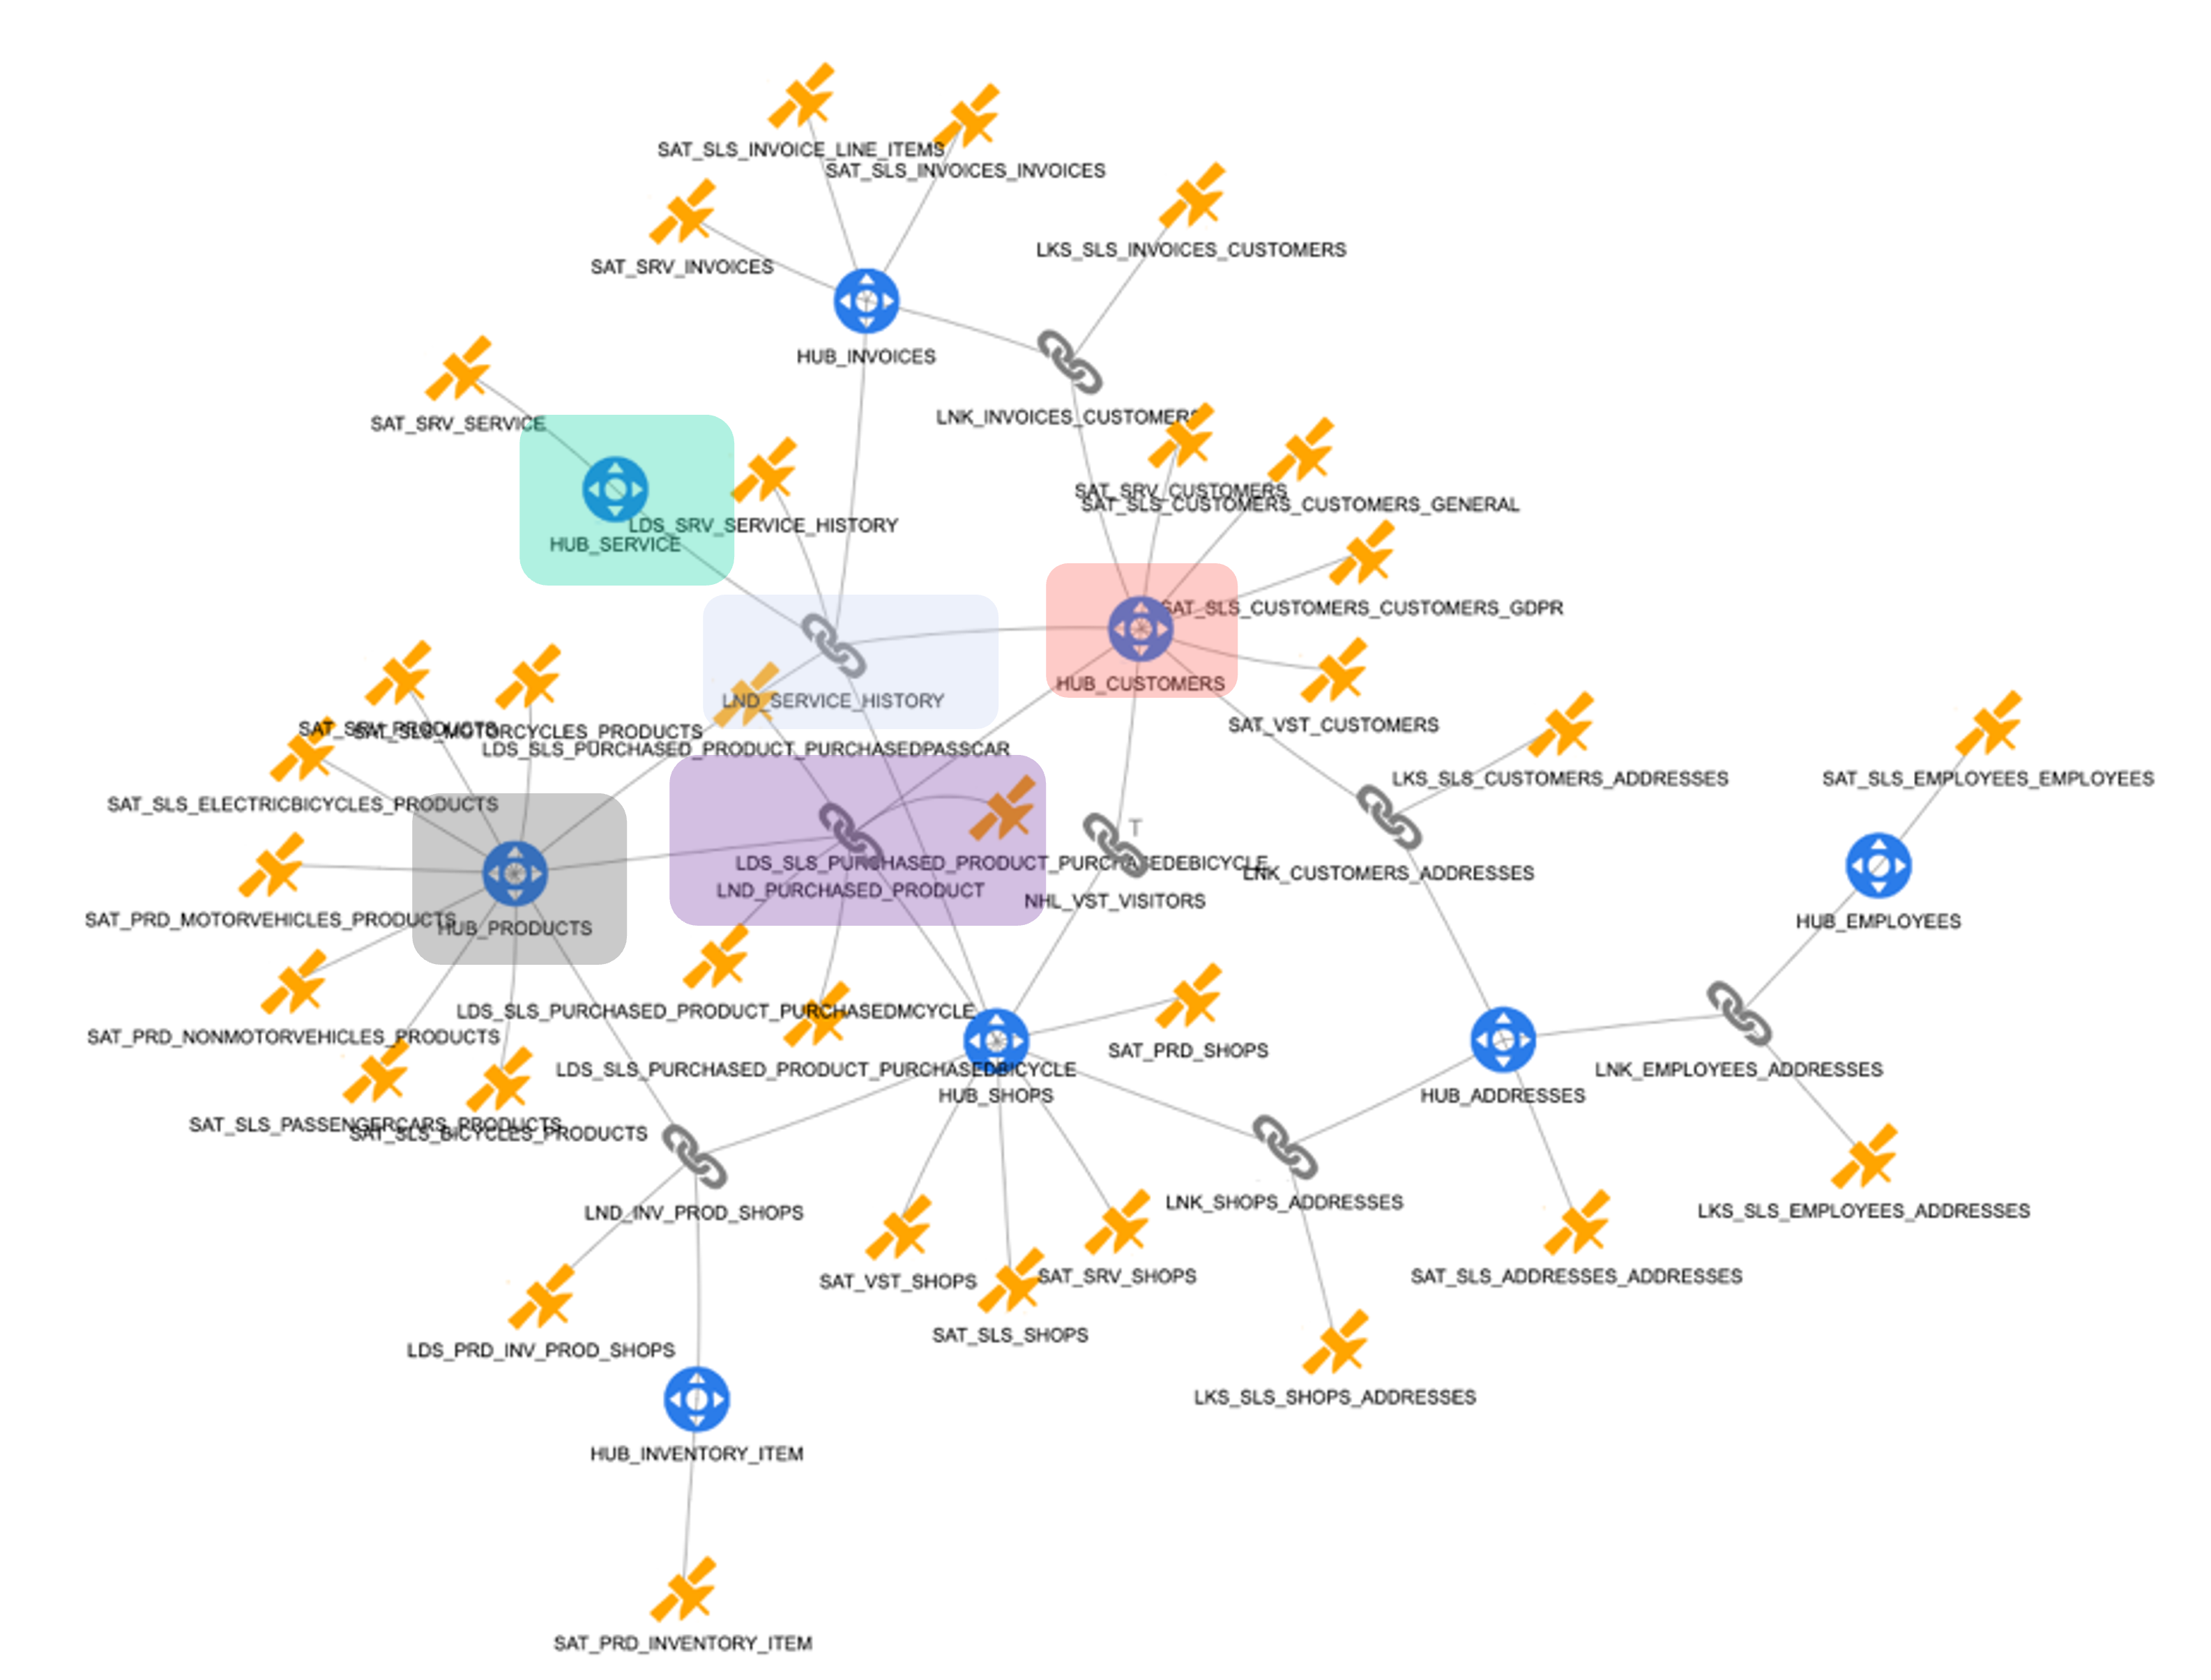
Picture 44 provides a comprehensive overview of the entire Data Vault model, integrating data from all three source systems. This unified structure enables the analysis of residential customer purchase behavior with full traceability and consistency.
To further simplify end-user querying, VaultSpeed also offers an additional automation layer that supports the creation of customized business logic and the presentation layer on top of the Data Vault. However, the details of that functionality are beyond the scope of this paper.
Picture 44
Does this scale?
Technical documents often rely on carefully crafted examples to explain complex ideas with clarity. These examples must strike the right balance—not so simple that they lack relevance, and not so complex that they obscure the core message. It's fair, then, to ask: does the Data Vault approach scale to real-world integration challenges?
The answer is yes—and here’s the proof.
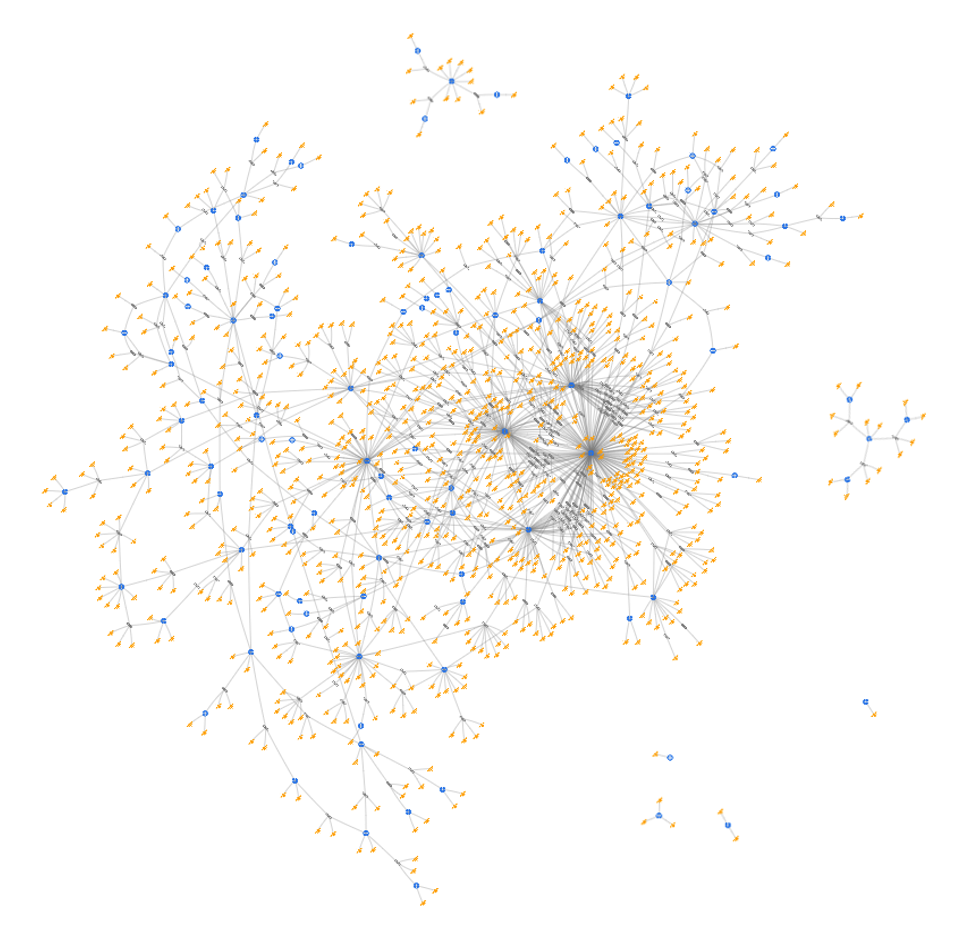
Picture 45 illustrates a real Data Vault model built for a large enterprise client. This project successfully integrated 58 diverse data sources and 592 distinct source objects. To protect confidentiality, the model is fully anonymized, yet several important observations can still be made.
First, you’ll notice that the number of hubs and links is significantly smaller compared to the volume of satellites. This reflects a deliberate effort to consolidate business keys—grouping data effectively around the most critical business concepts. Some hubs have an exceptionally high number of satellites, demonstrating the model’s efficiency and scalability.
Second, only a few hubs and satellites appear disconnected from the rest of the model—further reinforcing the strength of its integration.
If you filter out the satellites, the underlying business concepts and their relationships become clear, making it easy for business users to recognize and navigate their own processes within the model.
Crucially, this model wasn’t built all at once. The project followed an agile approach, gradually integrating new sources over time. Thanks to the flexibility of the Data Vault methodology, the team was able to add new components without reworking any previous structures—a powerful demonstration of adaptability at scale.
Picture 45
Conclusion
In conclusion, we successfully tackled the automation challenge and integrated data from three distinct sources into a cohesive, business-aligned Data Vault model. By using the business conceptual model as our foundation, we ensured that the resulting physical model accurately reflects business logic—making it both meaningful and accessible to business users.
VaultSpeed played a central role in this process. Its template engine leverages complete metadata access to convert repeatable logic into ready-to-deploy code—including DDL, DML, and workflow automation scripts. This code can be executed in your preferred data runtime environment, enabling fast, reliable deployment and ensuring your Data Vault model delivers value from day one.